About Stellate GraphQL Metrics
Stellate offers a GraphQL metrics feature that provides full observability for your GraphQL API.
Read Get Started with GraphQL Metrics for important information about the Logging API, which makes the data required to provide those insights available to Stellate.
Operating your GraphQL API in production requires a thorough understanding of the traffic it handles. With GraphQL Metrics, you can analyze aggregated GraphQL traffic data to uncover patterns and delve into individual requests to understand them in their complete context.
Between dissecting aggregate data and drilling deep into individual requests, you can get the insights you need to improve your GraphQL API in production.
Secure data collection
The user or developer setting up the Stellate Metrics Logging Plugin is in full control of what if any personal data gets sent. The plugin does not require any personal data to be sent to provide metrics information.
Gain insights into GraphQL API usage patterns
Stellate GraphQL Metrics gives you insights into your GraphQL API usage patterns to estimate bandwidth savings, compute savings, and potential performance improvements. You can:
- Analyze the most frequent operations, operations with the highest bandwidth consumption, and the most impactful operations for caching.
- Utilize this data to predict potential decreases in request volume and bandwidth usage, enabling you to assess potential cost savings, performance improvements, and stability gains based on your data.
You have two options for understanding your GraphQL Metrics with Stellate . You can start with a free service or one of the billed services.
Types of Stellate Metrics
Once you have enabled your metrics, the Stellate platform offers three tabs for Metrics, Requests, and Config options and several types of metrics. You can select from several metric categories to drill down into key insights into your GraphQL API. They are located on the left-side of your display. The display defaults to the Metrics tab and Caching Insights metrics.
The Stellate GraphQL platform offers several types of metrics. You can select any of the following metric categories to drill down to gain key insights into your GraphQL API requests.
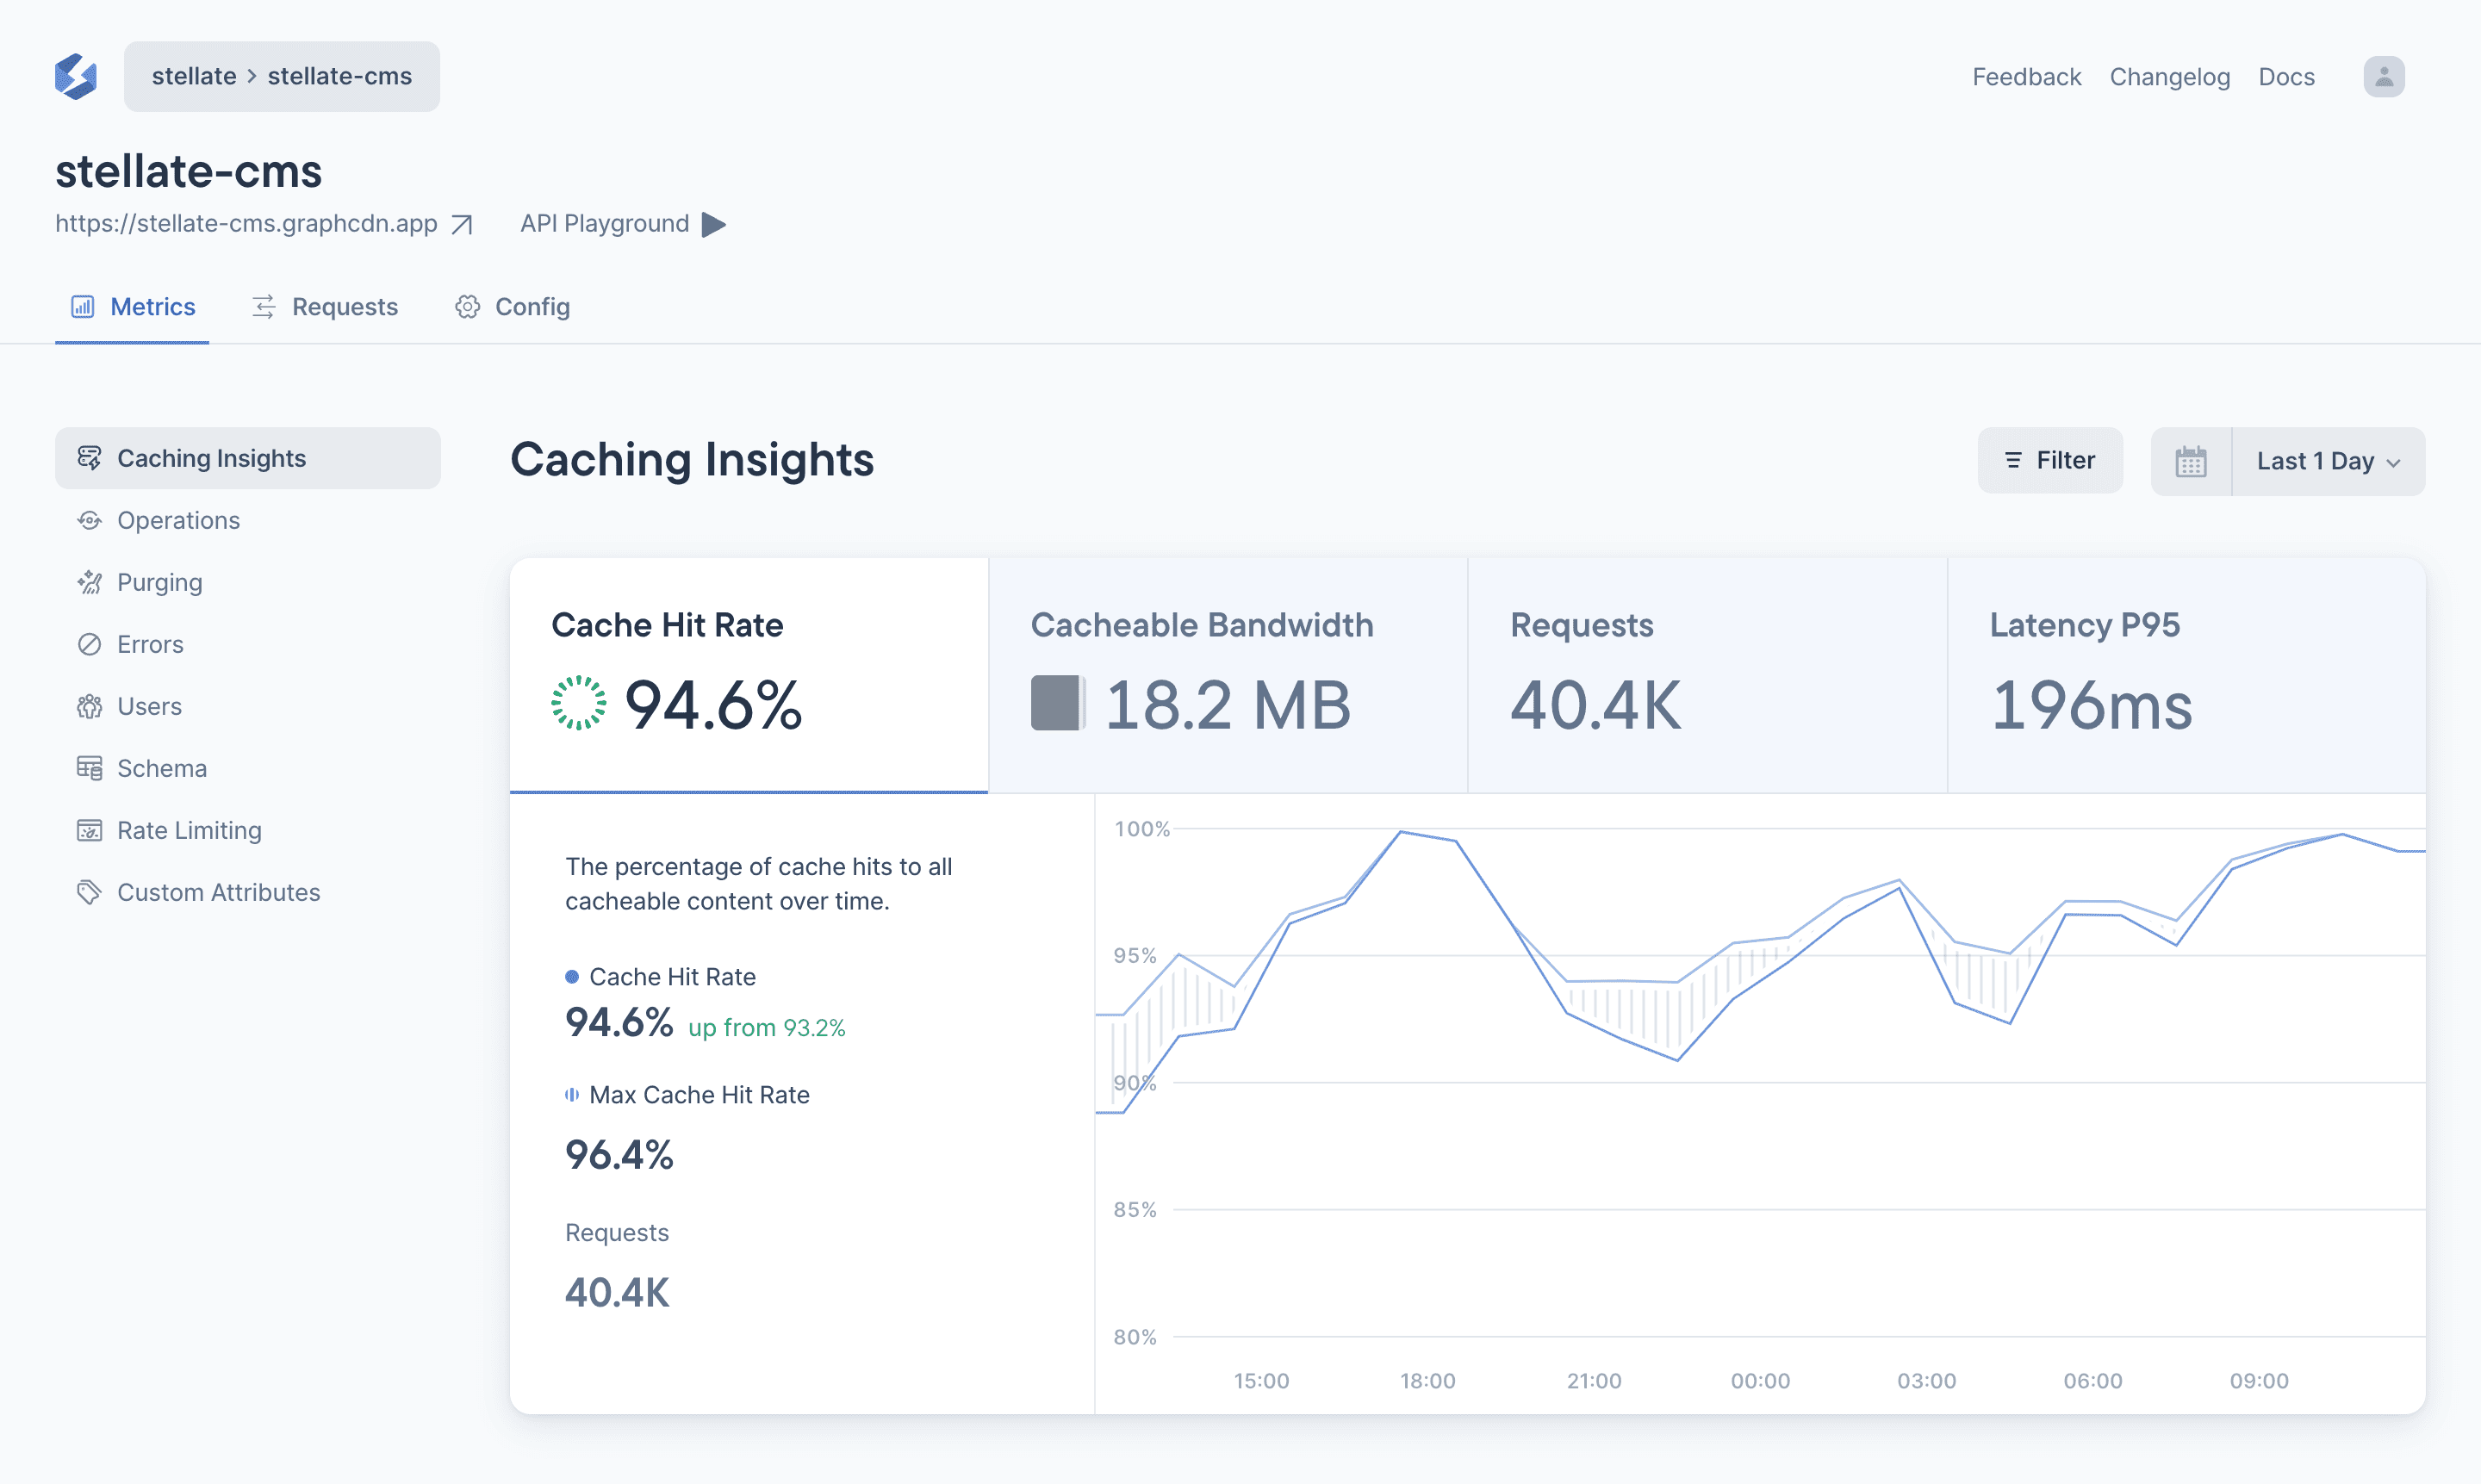
Caching Insights
Gives you rich insights into your Cache Hit Rates (CHR) and Cache Bandwidth. For more detailed information about these metrics, read Caching Insights and Stellate Edge Cache Statues.
Operations
With Operations metrics, we provide insights into each operation identified by name. Operation names are used to bundle multiple requests for the same data into a single category. In our edge proxy layer, we monitor every distinct operation. Since GraphQL assigns a name to each operation, our operations view presents aggregated data based on operation names. This implies that if you have 1000 requests for an operation named “getTodolists,” you can view the aggregated data (such as, p95 latency, average CHR, and so forth.) in the Operations view.
Purging
These metrics track cache invalidation data. Cache invalidation allows you to remove or purge cached results. The Purging metrics show statistics on how data gets invalidated from the cache. Read the Purging API documentation for more information.
Errors
When your requests do not respond as intended, it is crucial to gain observability into errors in order to improve the situation for your users.
Users
User metrics show you the performance, latency, and other usage information for your customers around the world. With this set of metrics, you can see the geographic locations where your requests originate and drill down into the details.
Schema
The Schema metrics breakdown information by schema types, delivering CHR, Requests, and IP information.
Rate Limiting
These metrics track the impact of your rate limiting configuration. Rate limiting allows you to define certain rules for when traffic is allowed and when traffic is getting blocked. This product is in an alpha phase and only available to select customers.
Custom Attributes
You can customize your GraphQL Metrics by defining a set of Custom Attributes. These attributes are extracted for each request sent to your Stellate service, stored in our metrics database, and made available to you through our metrics dashboard and Public GraphQL API.
Methods for Collecting Metrics
Stellate provides multiple methods for getting GraphQL metrics:
Simplest is to started collecting metrics using the Stellate UI. To do this, read the step-by-step instructions in the Get Started with Metrics topic. This topic guides you through the UI to implement metrics collection and provides a short summary of the other methods. The following sections illustrate different methods for collecting metrics.
Metrics Plugin
To use these plugins, read the Metrics Plugins topic. You can also build your own manual metrics call. To do this, read the Build a Metrics Manual Call topic.

Stellate Edge Proxy

To use the Edge Proxy, read the Use the Edge Proxy for GraphQL Metrics topic.
Collecting metrics works virtually the same, with either method. Note that when you set up Stellate Edge Caching, it means you are using Stellate through our Edge Proxy. When using the Proxy, request logging is no longer necessary as we automatically track every request that passes through it. Also you can still collect metrics even if caching is disabled, both with the proxy and with the request logging plugins or manual call.
Using API
In addition to using the pre-built plugins described in the Metrics Plugins topic, you can build your own call. To do this read the Metrics Logging API.