Announcing Our New GraphQL Metrics: Full Observability for Your GraphQL API
On day 2 of our launch week, we’re excited to announce the most significant update with the new Stellate dashboard: our brand-new GraphQL Metrics! 🥳
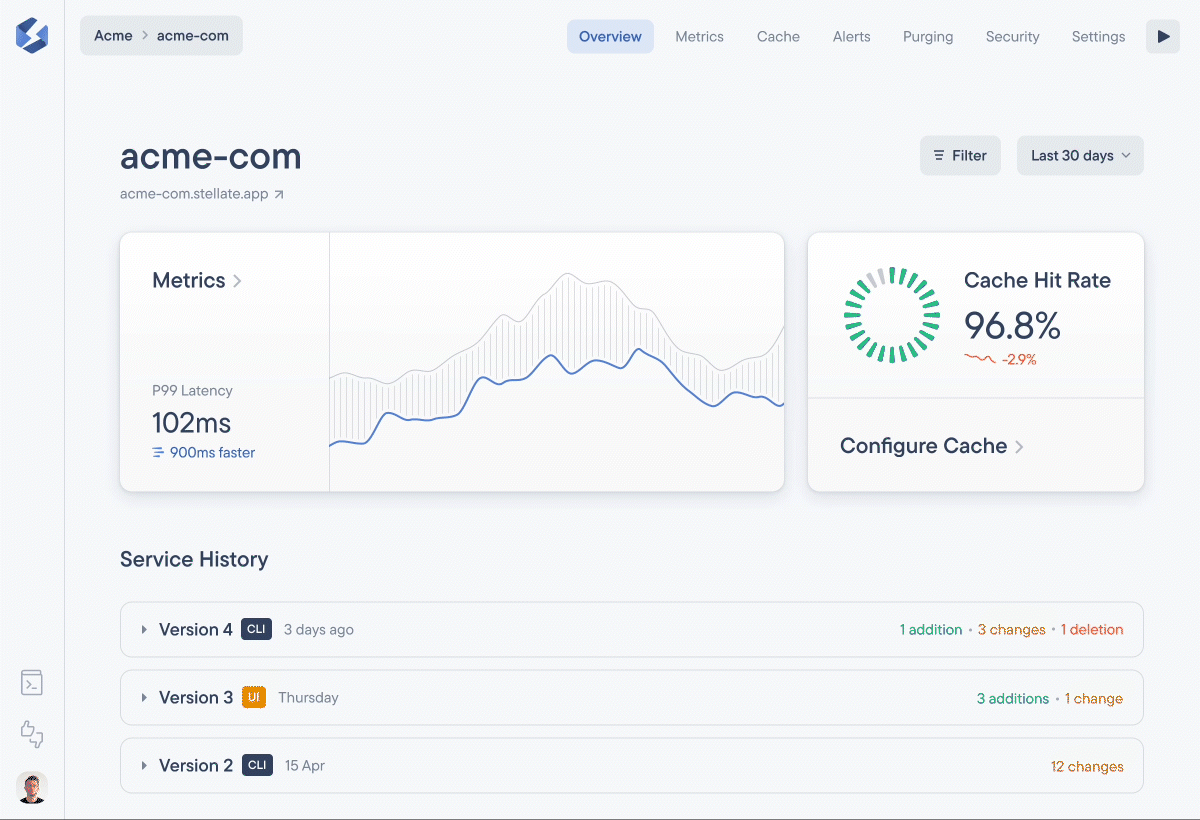
Confidently operating your GraphQL API in production requires a deep understanding of the traffic it handles. We shipped basic caching analytics early on to help our users configure their GraphQL edge cache, but we knew we wanted to go deeper.
With our new GraphQL Metrics, you can dissect aggregate GraphQL traffic data to discover patterns and drill deep into individual requests to understand them in their full context! Let’s take a look. 😎
Slice and Dice Your Aggregate GraphQL Traffic
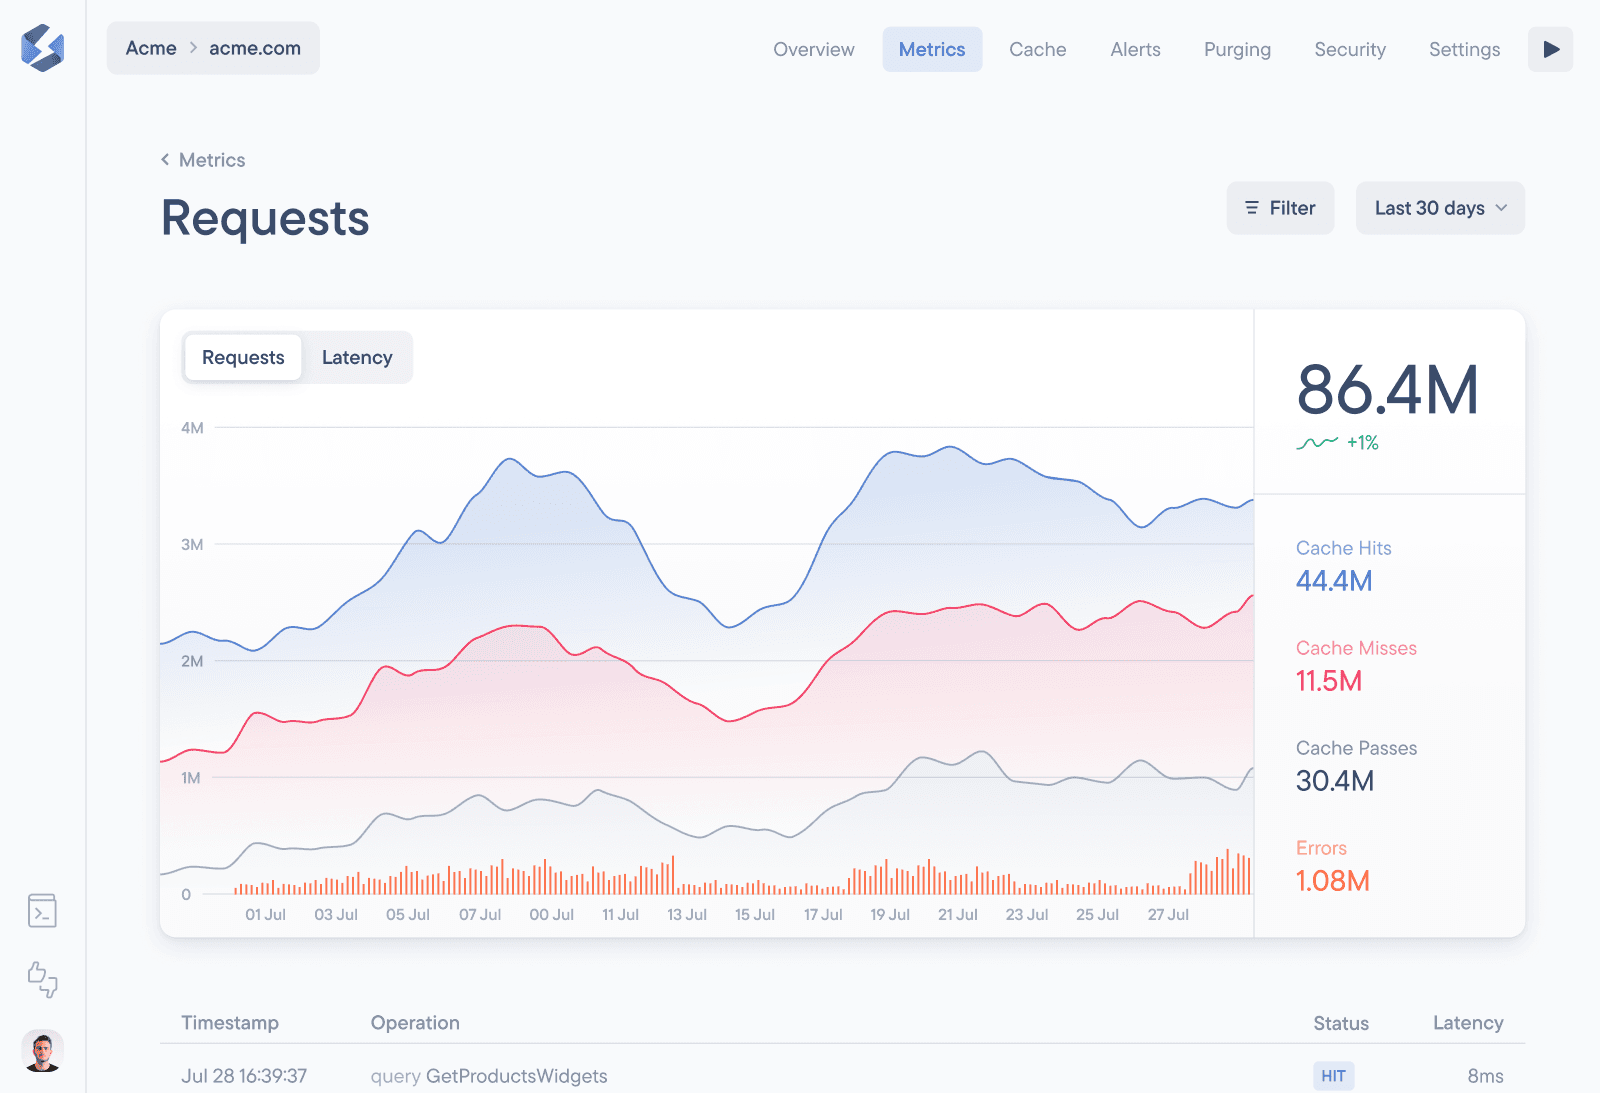
Our new filtering system allows you to slice and dice your aggregate GraphQL traffic based on any of its properties. The filters are applied globally across the whole dashboard, allowing you to get insights into any specific kind of traffic:
Want to analyze requests for the getFeedback operation, sent from all continents except Oceania and using the Chrome browser? No problem:

We currently support filtering by any combination of these properties:
GraphQL Operation
GraphQL Type
HTTP Referer
Country Code
Continent Code
Browser
Device
We’re going to keep adding more filters over time, so if you have ideas for what else you’d like to filter for, let us know in our Discord community!
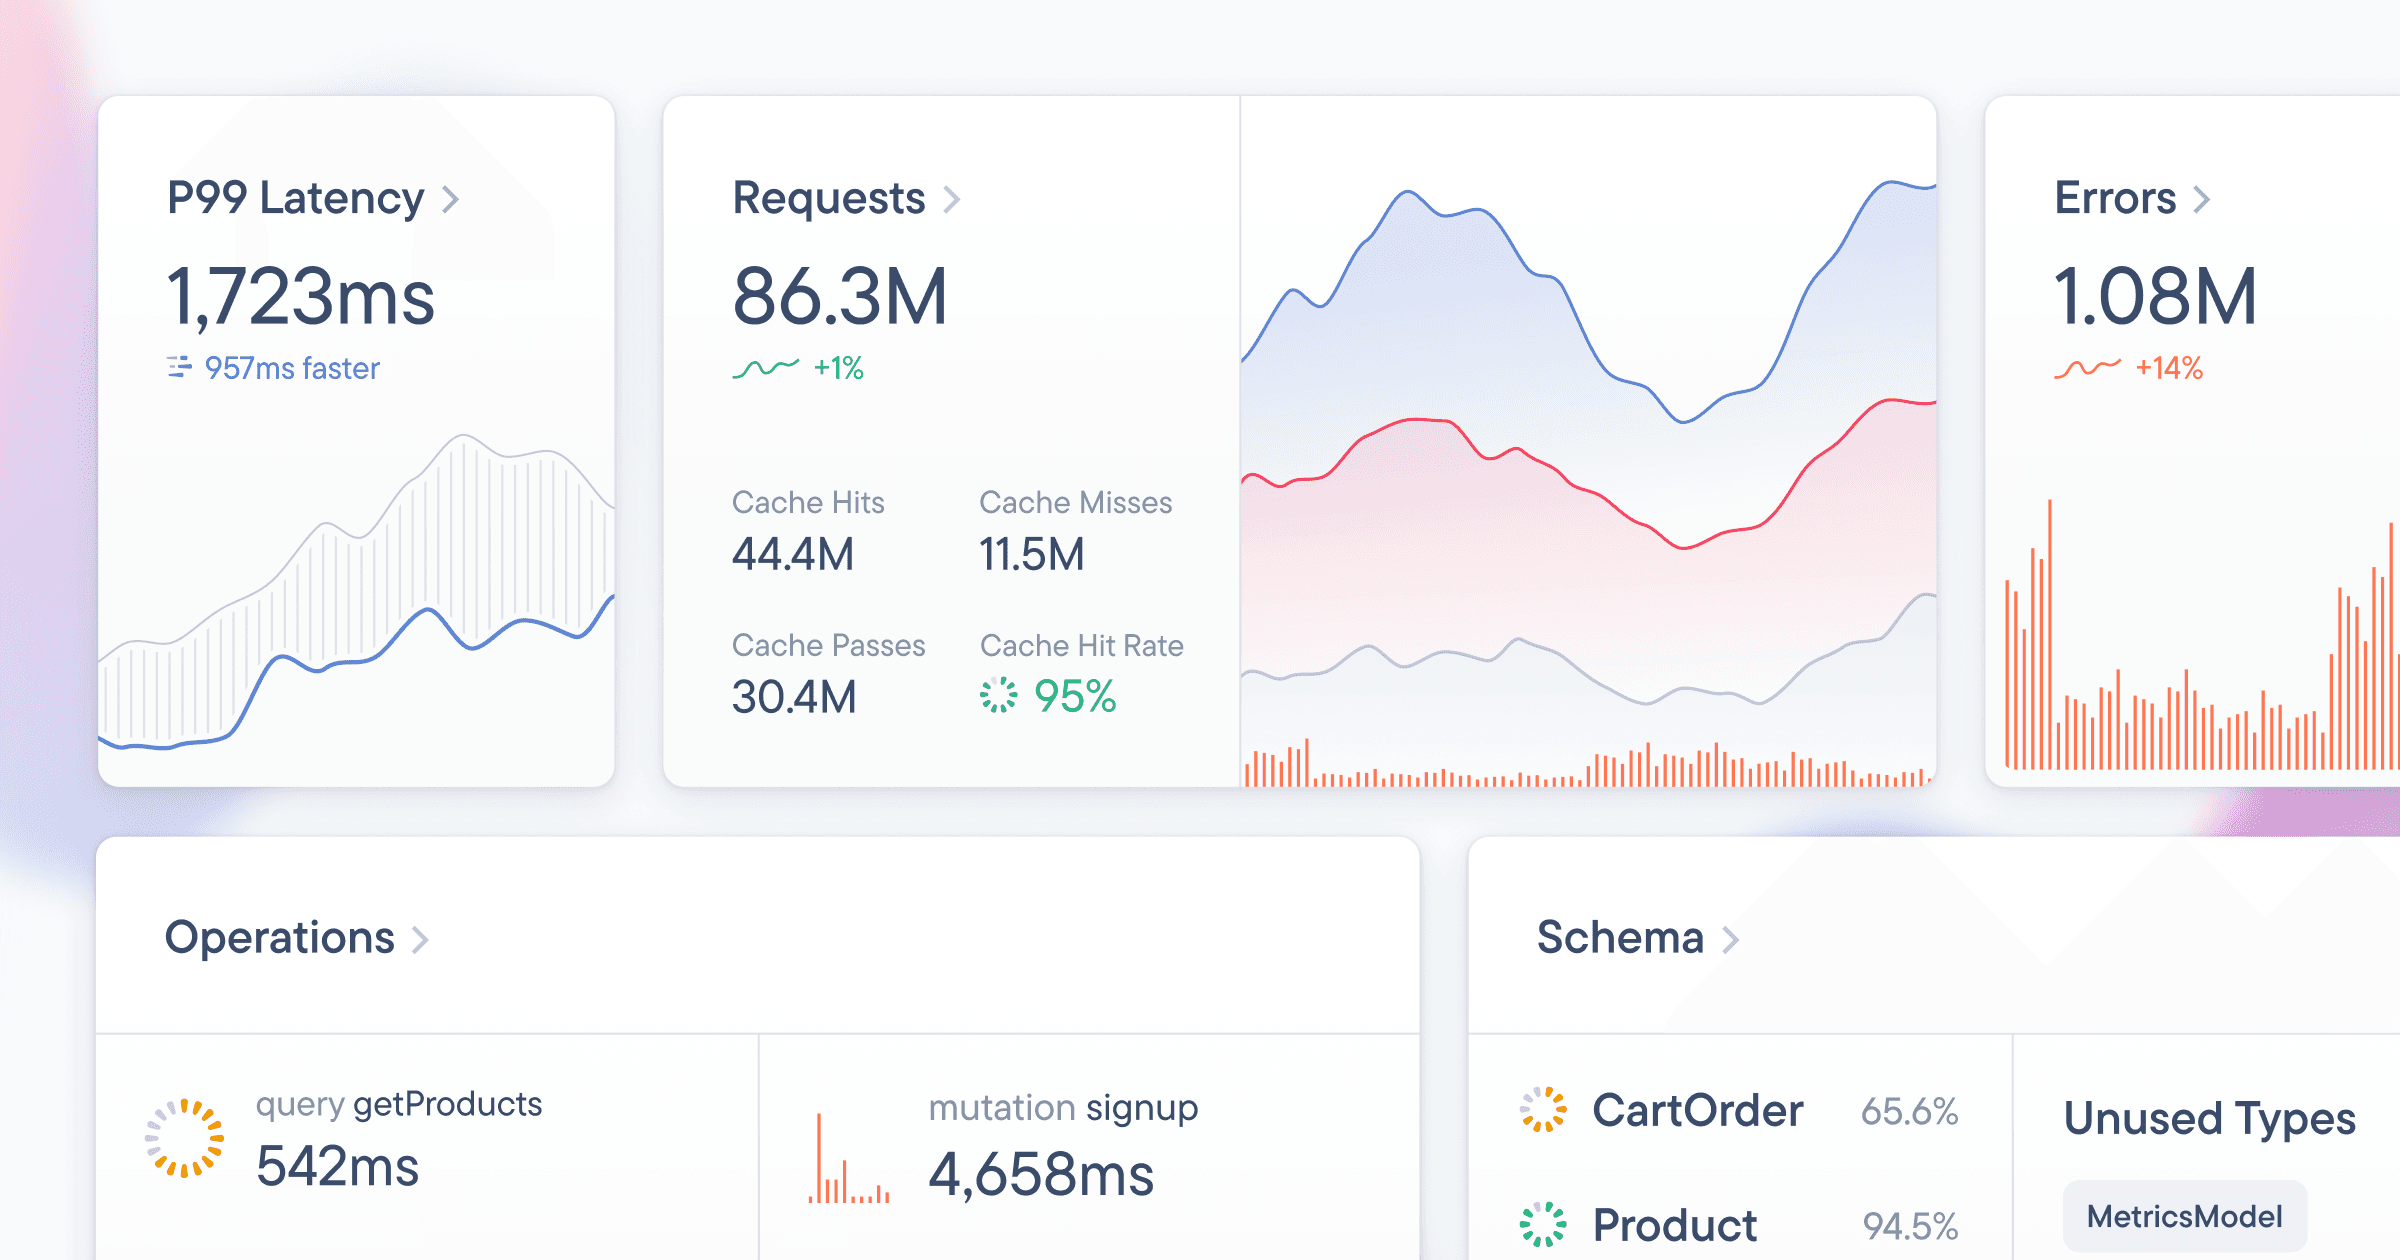
In-Depth GraphQL Performance Monitoring
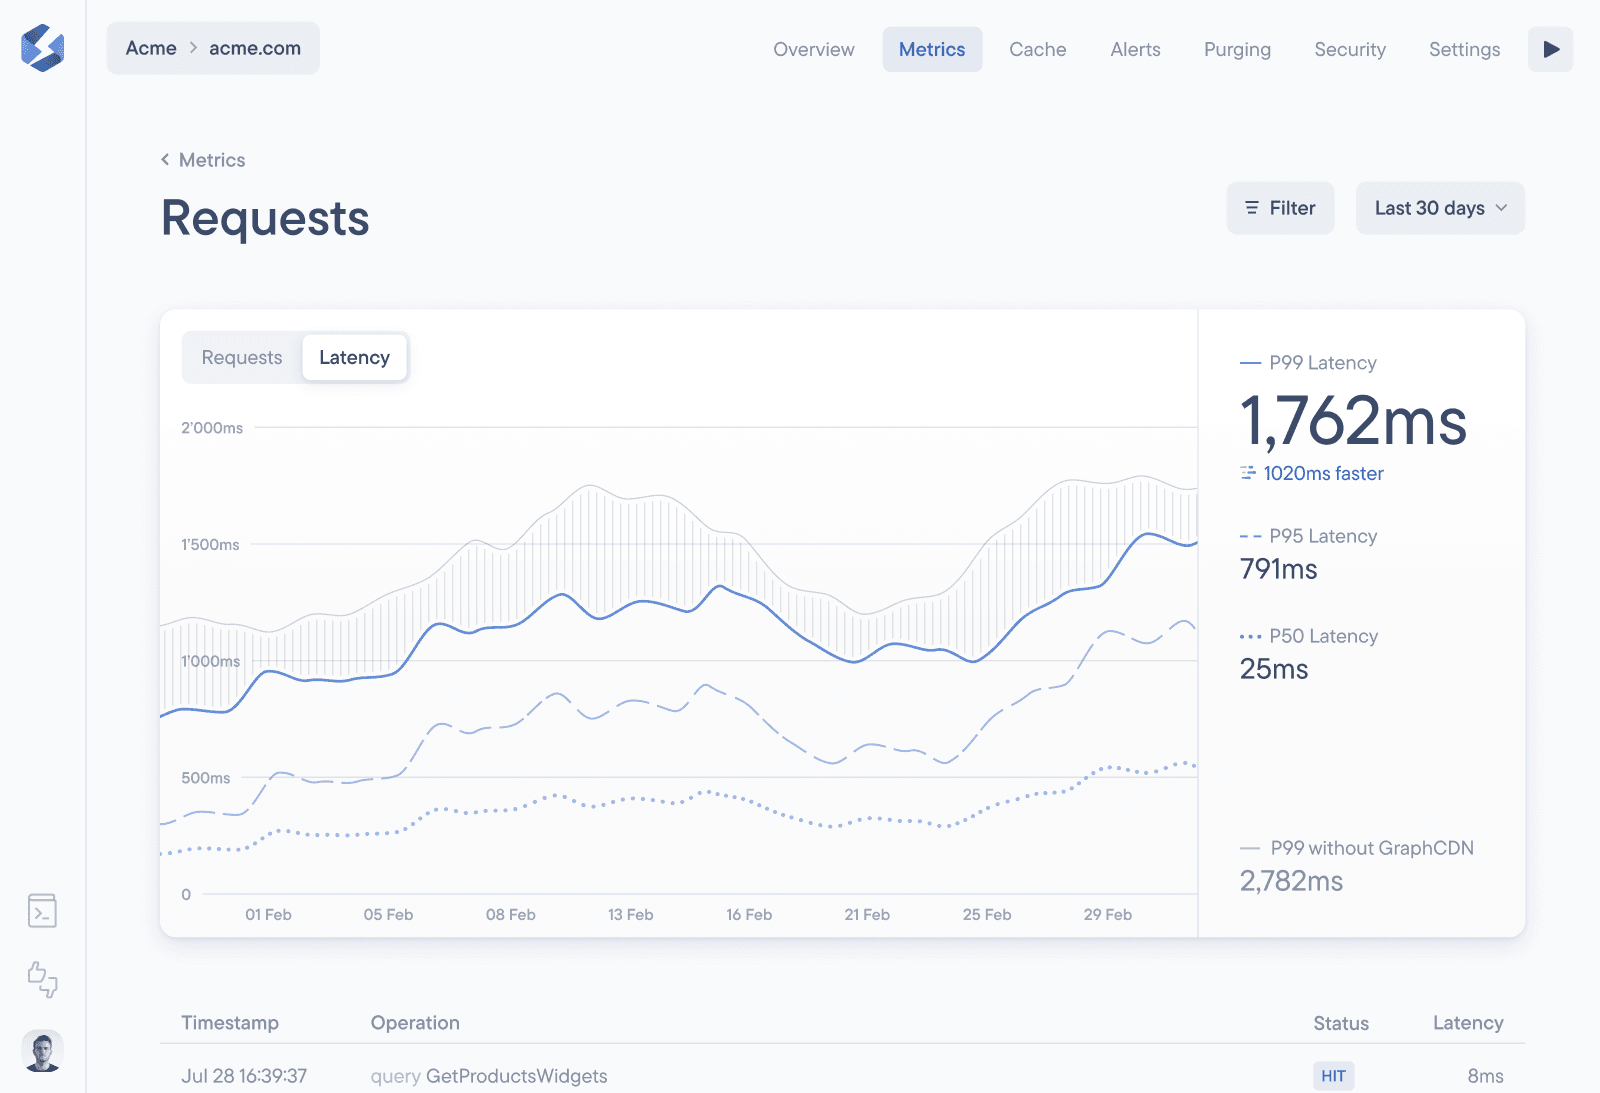
It’s crucial to understand how fast your API responds to your users requests and (if you’re using it) to understand how much faster edge caching makes your API.
What are our APIs p50, p95 and p99 response times? When did we introduce the performance regression for the getPost query? How much faster has edge caching made our API overall?
All of these questions (and many others) can be answered with our GraphQL Metrics. As you can imagine, you can apply any filters on this graph to pinpoint performance issues that only occur in specific situations!
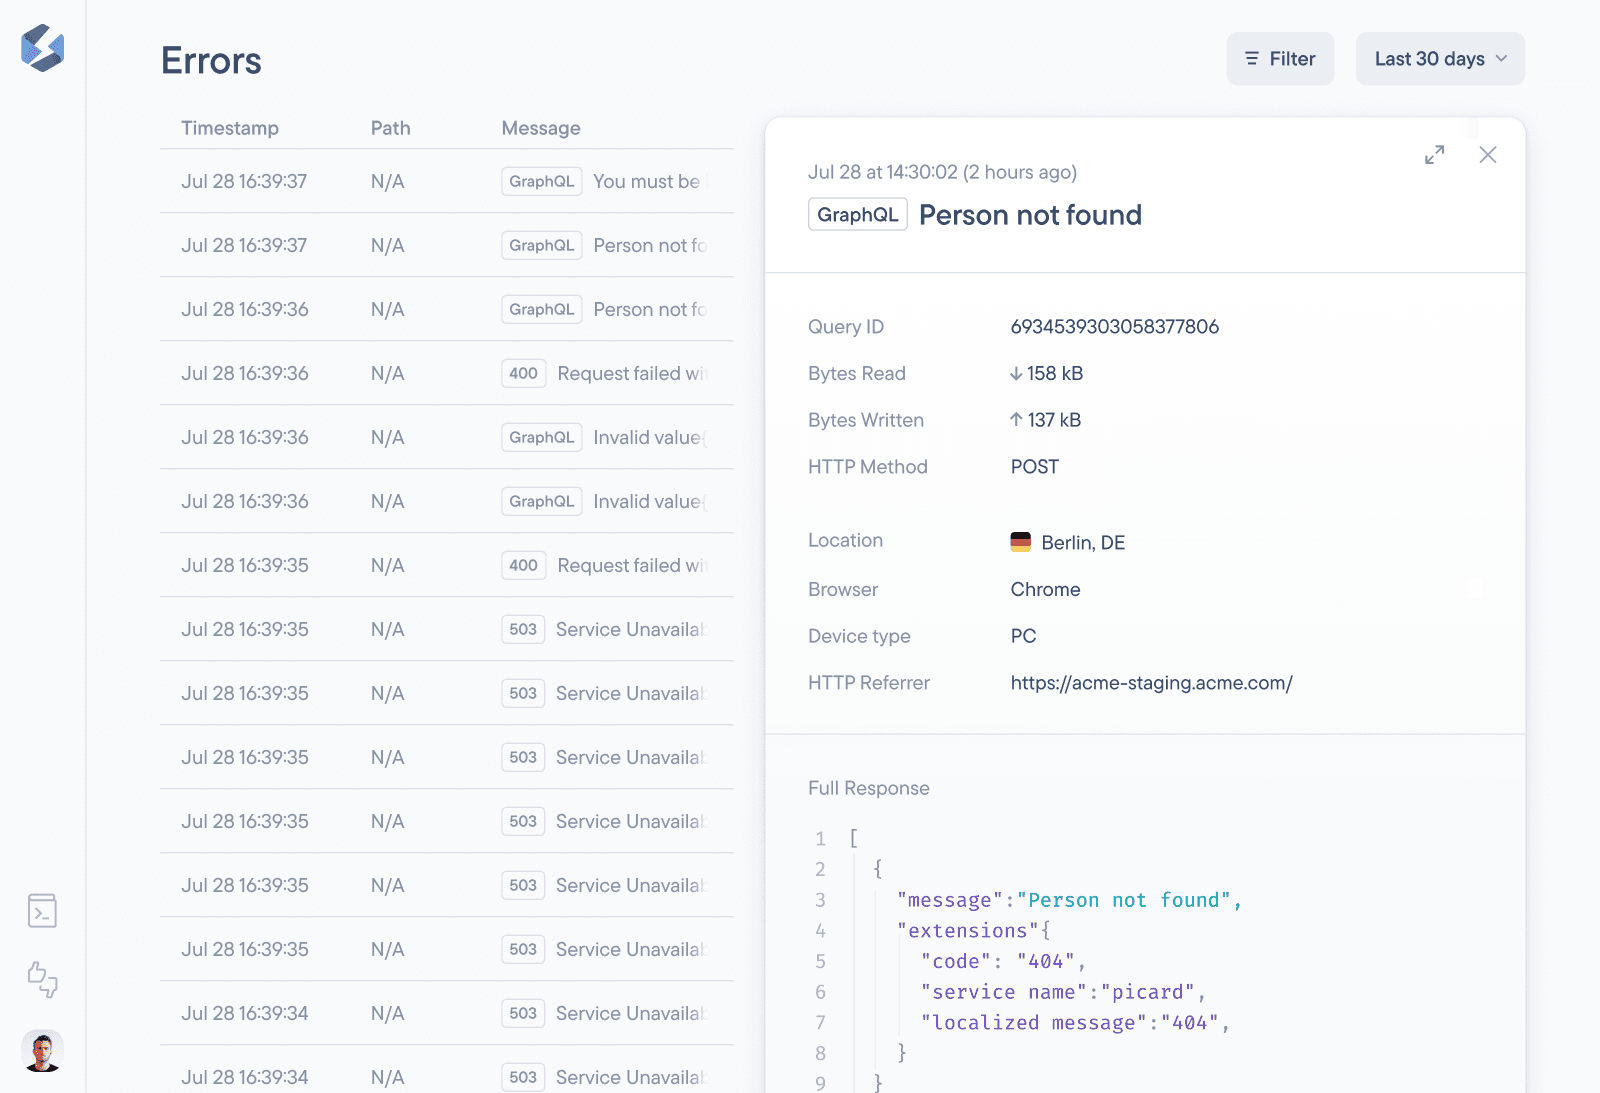
Individual GraphQL Request Observability
Each GraphQL operation that your API supports can behave quite differently. What’s the latency? What’s the error rate? How often does it happen?
With our GraphQL Metrics, you’re able to see metadata about every single individual request that your GraphQL API has handled with all of its details:
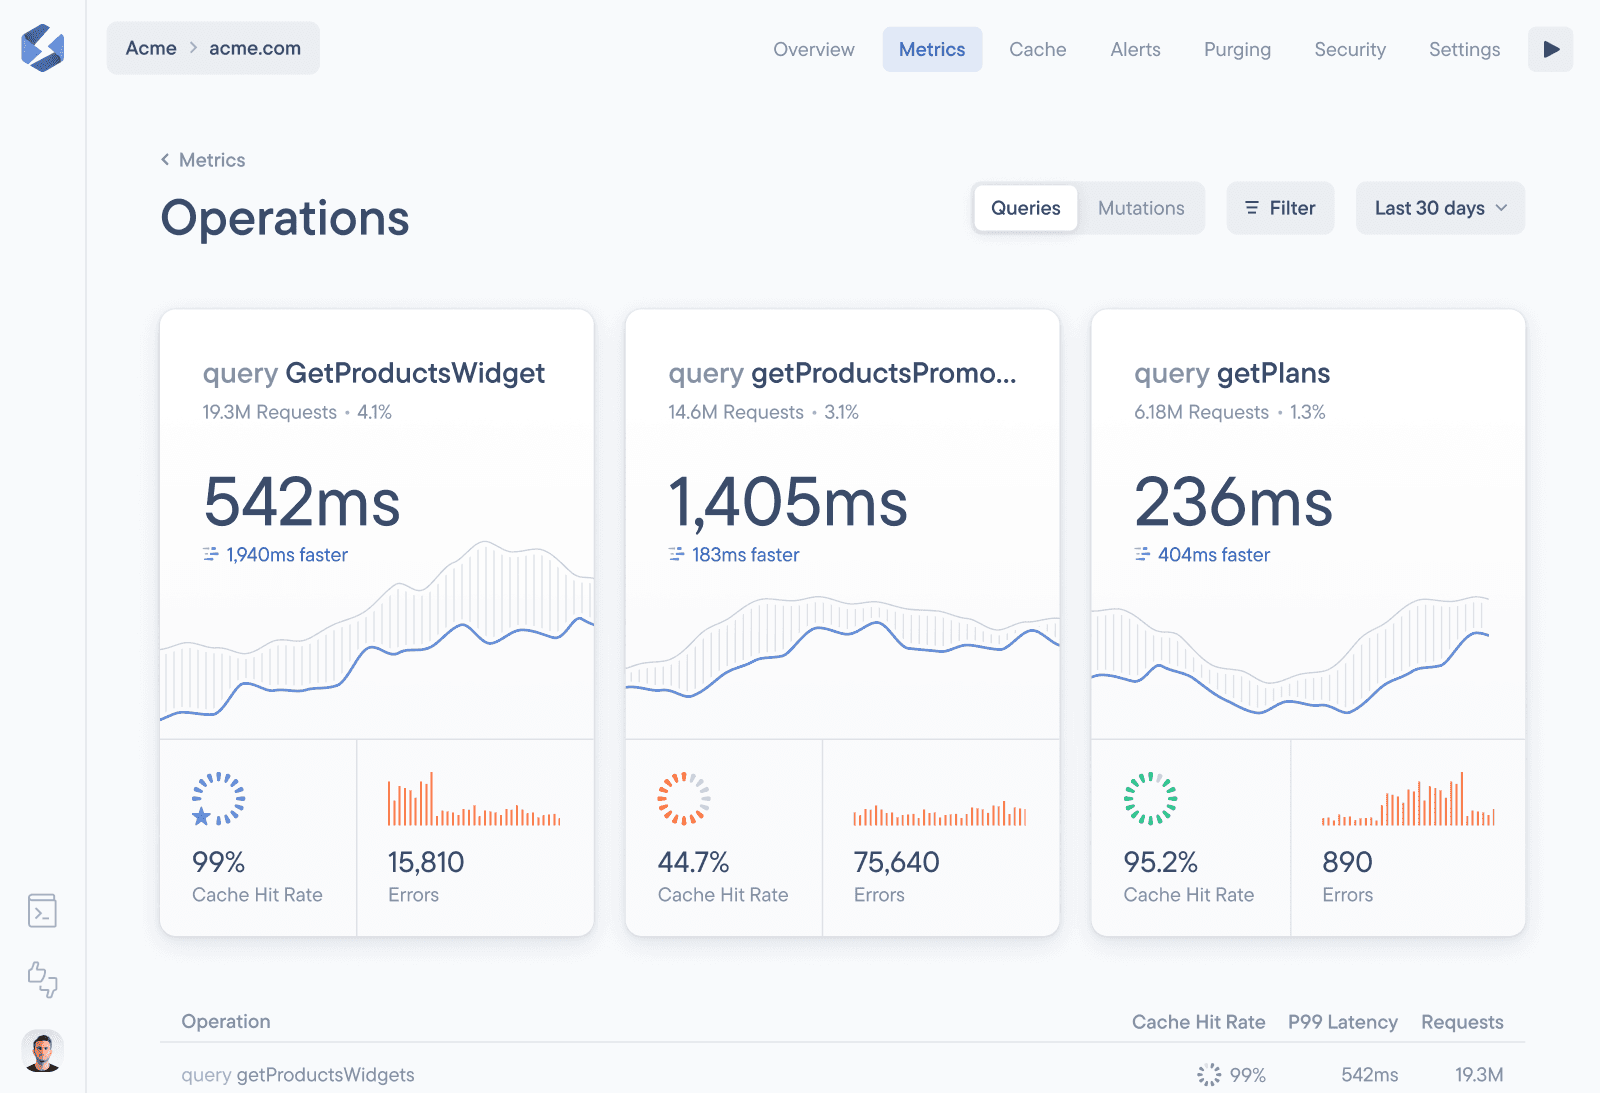
You can see details for each operation:
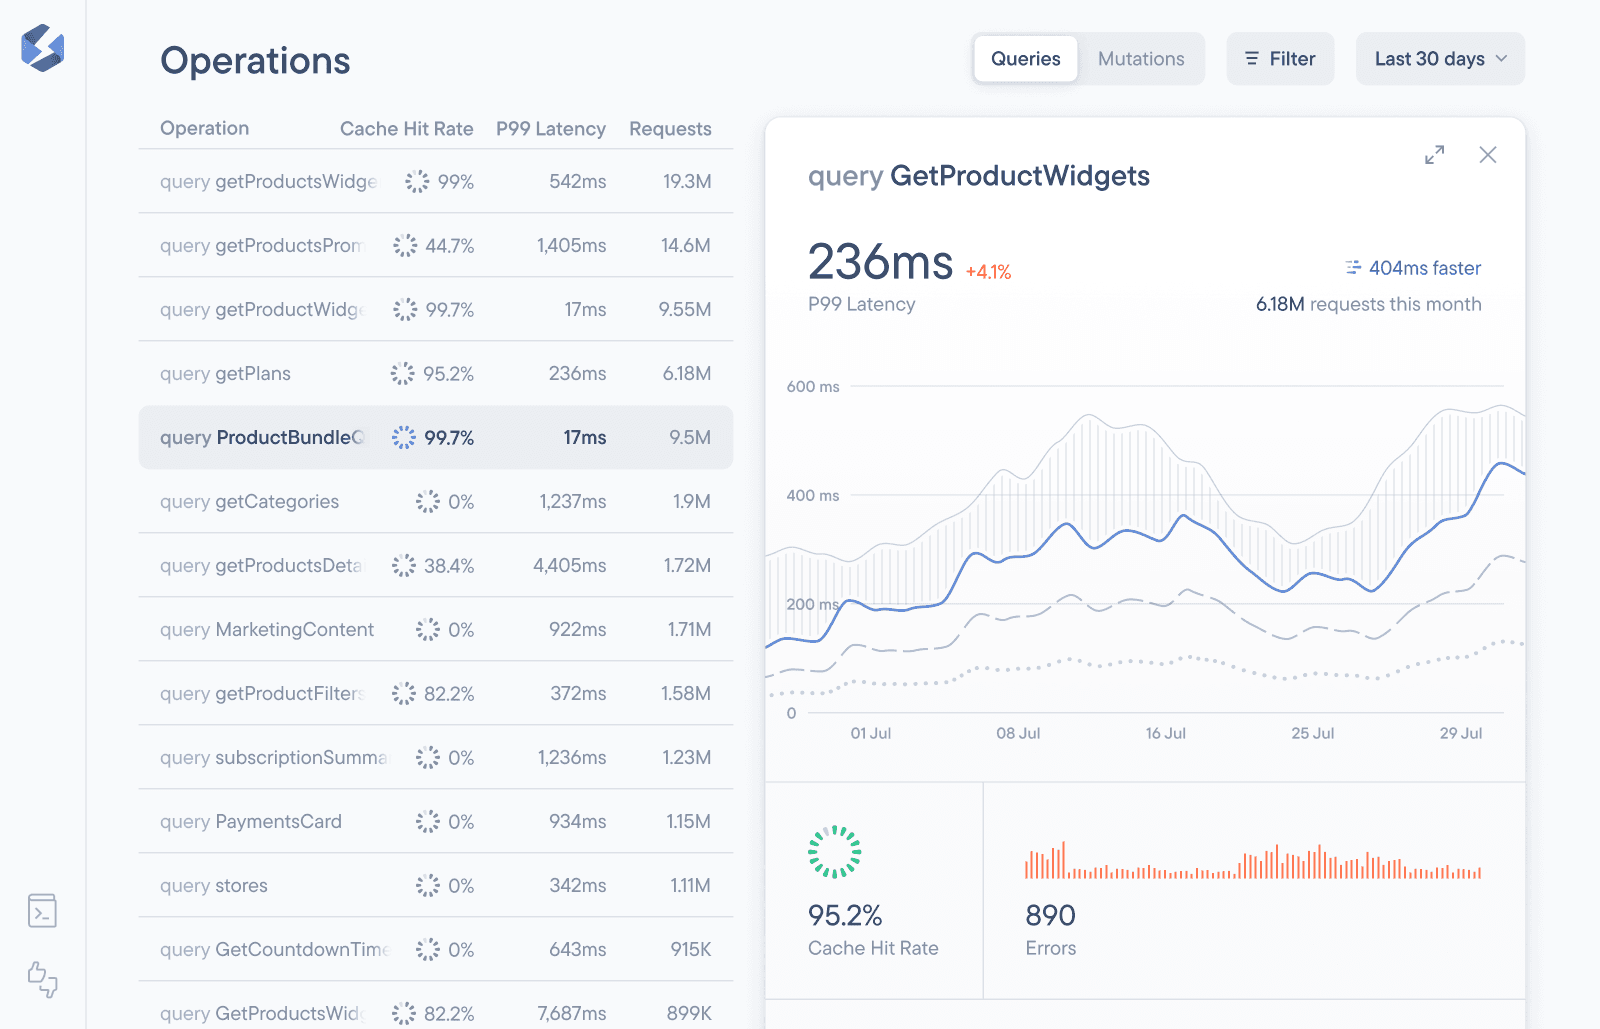
On top of that, you can see information about any edge retries if the request initially failed and, for our edge caching users, you can also see why certain requests were cache hits, misses or passes to help you to debug your caching configuration:
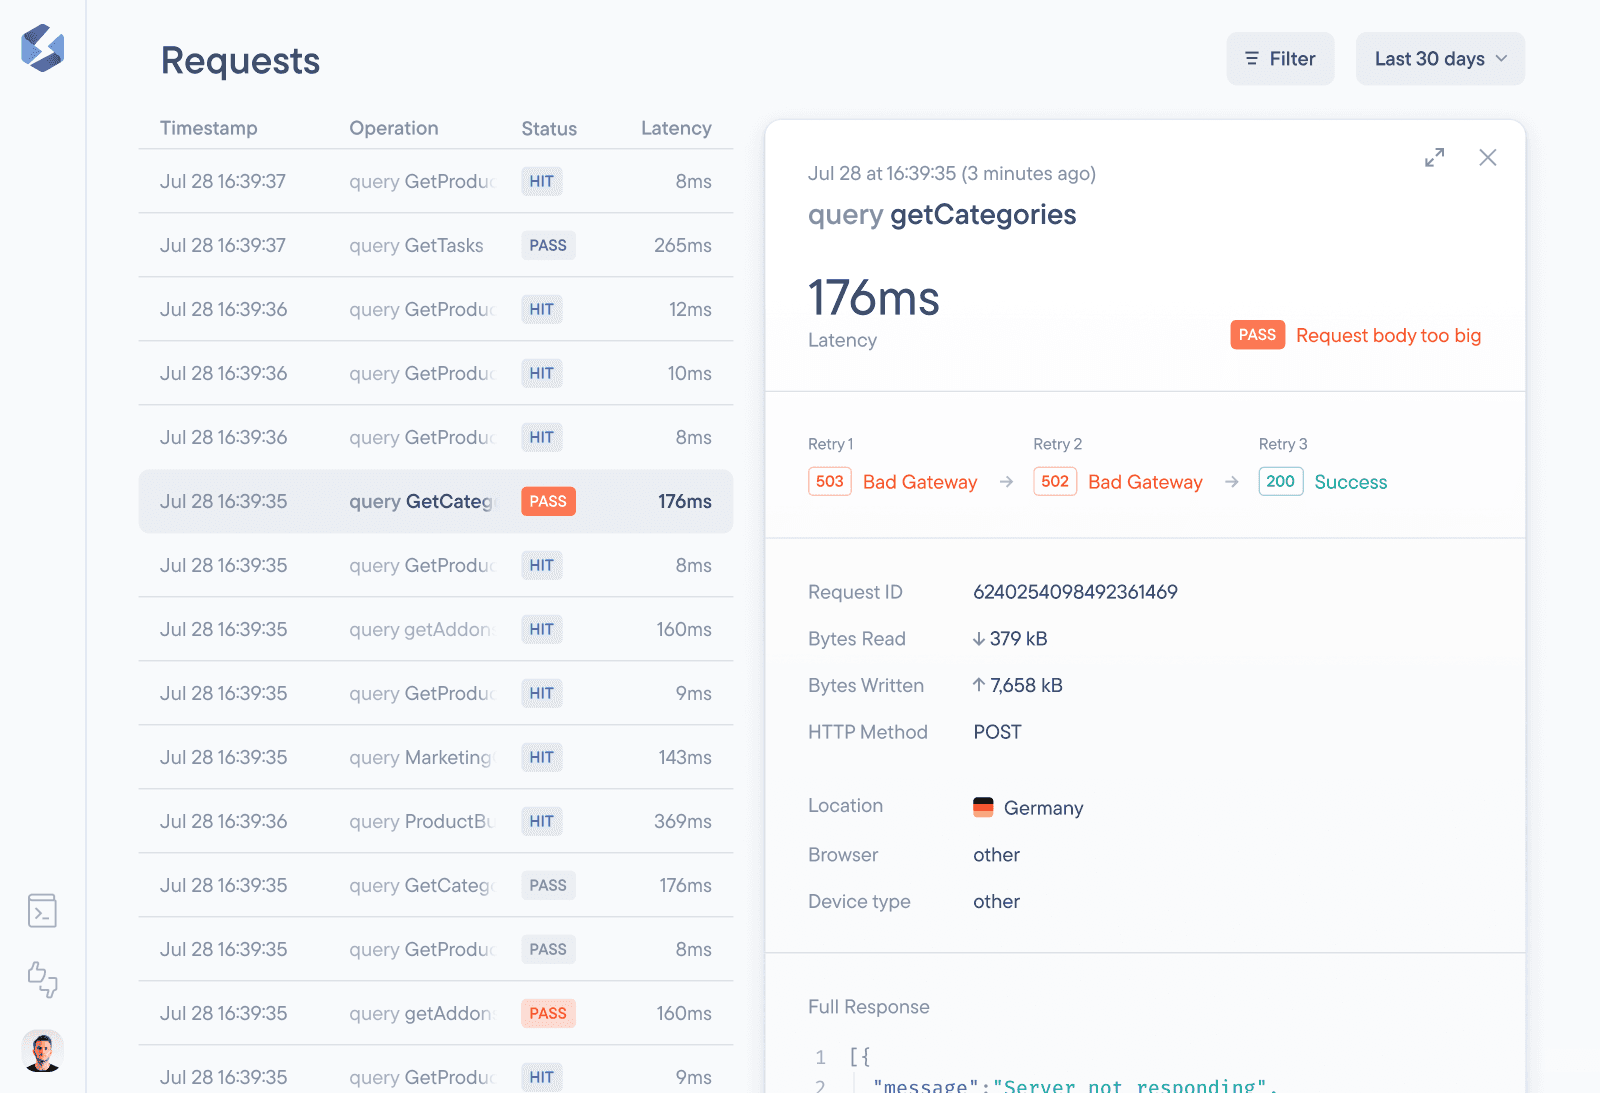
Detailed GraphQL Error Tracking
Requests do not respond as intended, so observability into errors is crucial to be able to improve the situation for your users:
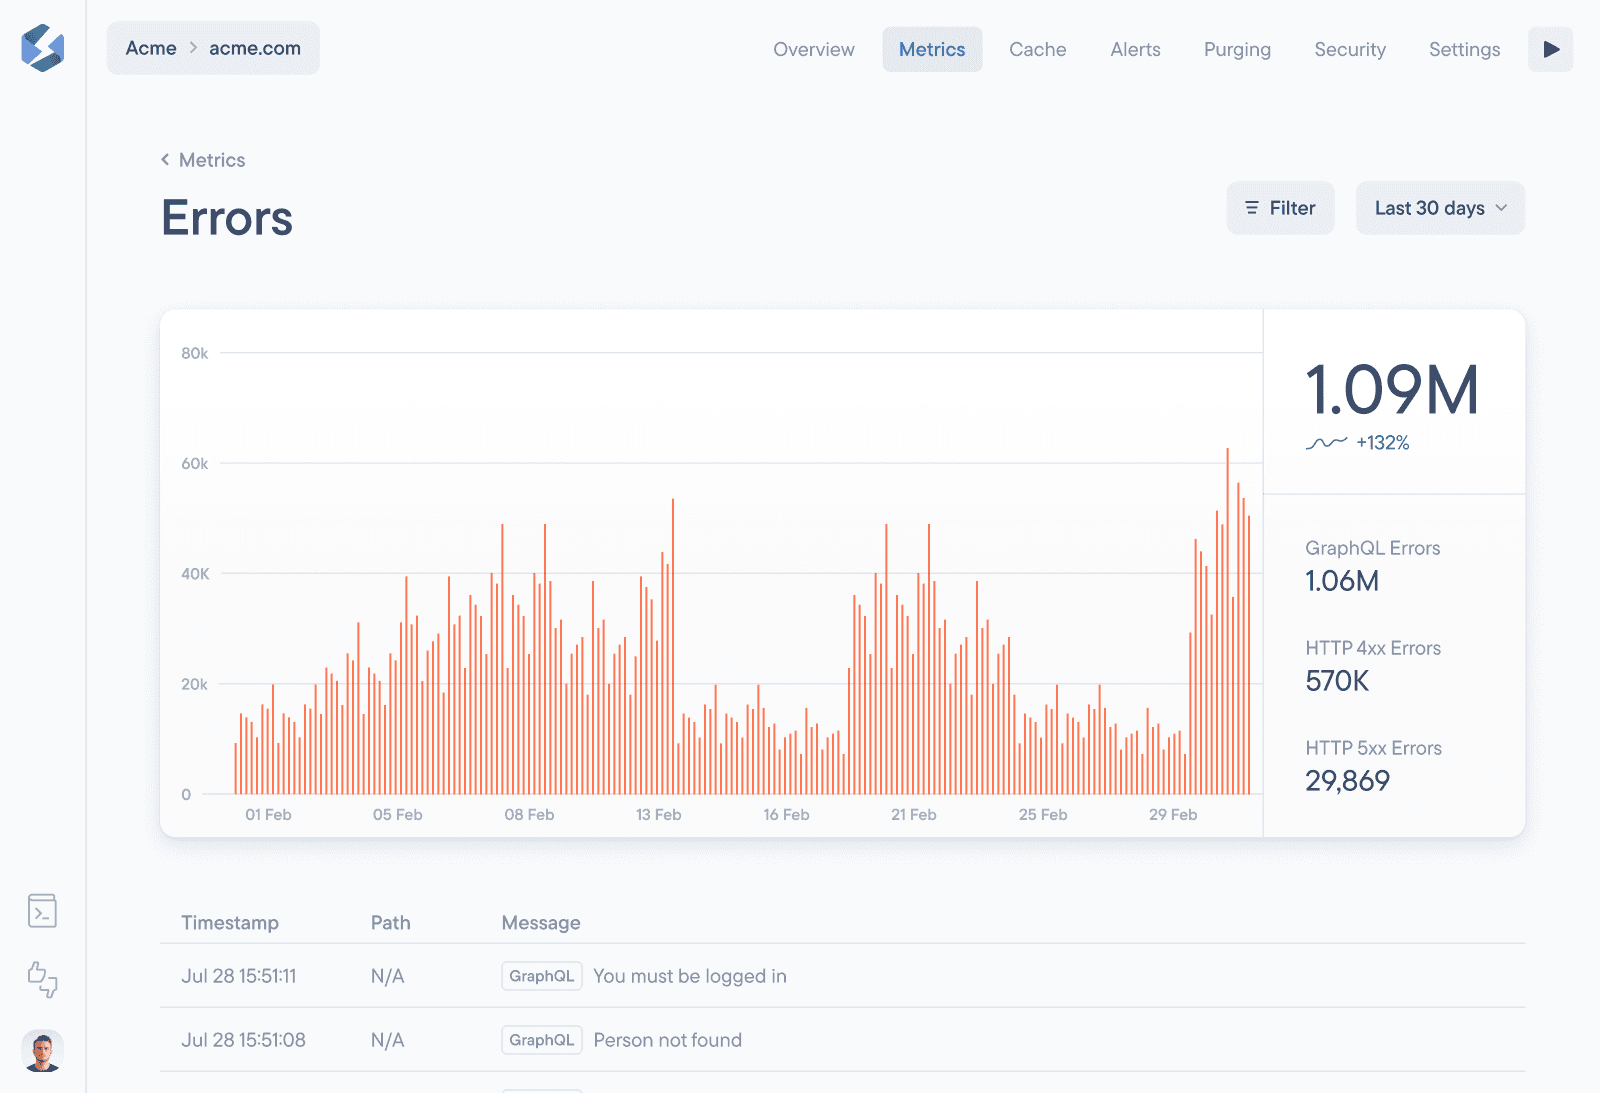
Being able to drill down to specific errors and their request’s details was one of the most requested features. You asked for it — we delivered!
Wrapping Up
Our new GraphQL Metrics bring deep observability to any GraphQL API and works fantastically in combination with our edge caching. Between dissecting aggregate data and drilling deep into individual requests, you can get any insight you need to improve your GraphQL API in production.
While we’re focused on announcing the rest of the changes this week, you already have access to our new GraphQL Metrics today! If you’re not already a Stellate user, sign up for free and try them out today.