Charles Brown
Head of Application Services, Formidable Labs
GraphQL Metrics
Real-time observability for your GraphQL APIs usage, performance and errors. Get started in minutes by installing the plugin for your GraphQL Server.
After every release, we open up Stellate's GraphQL Metrics to monitor the health of our GraphQL API in real-time.

Charles Brown
Head of Application Services, Formidable Labs
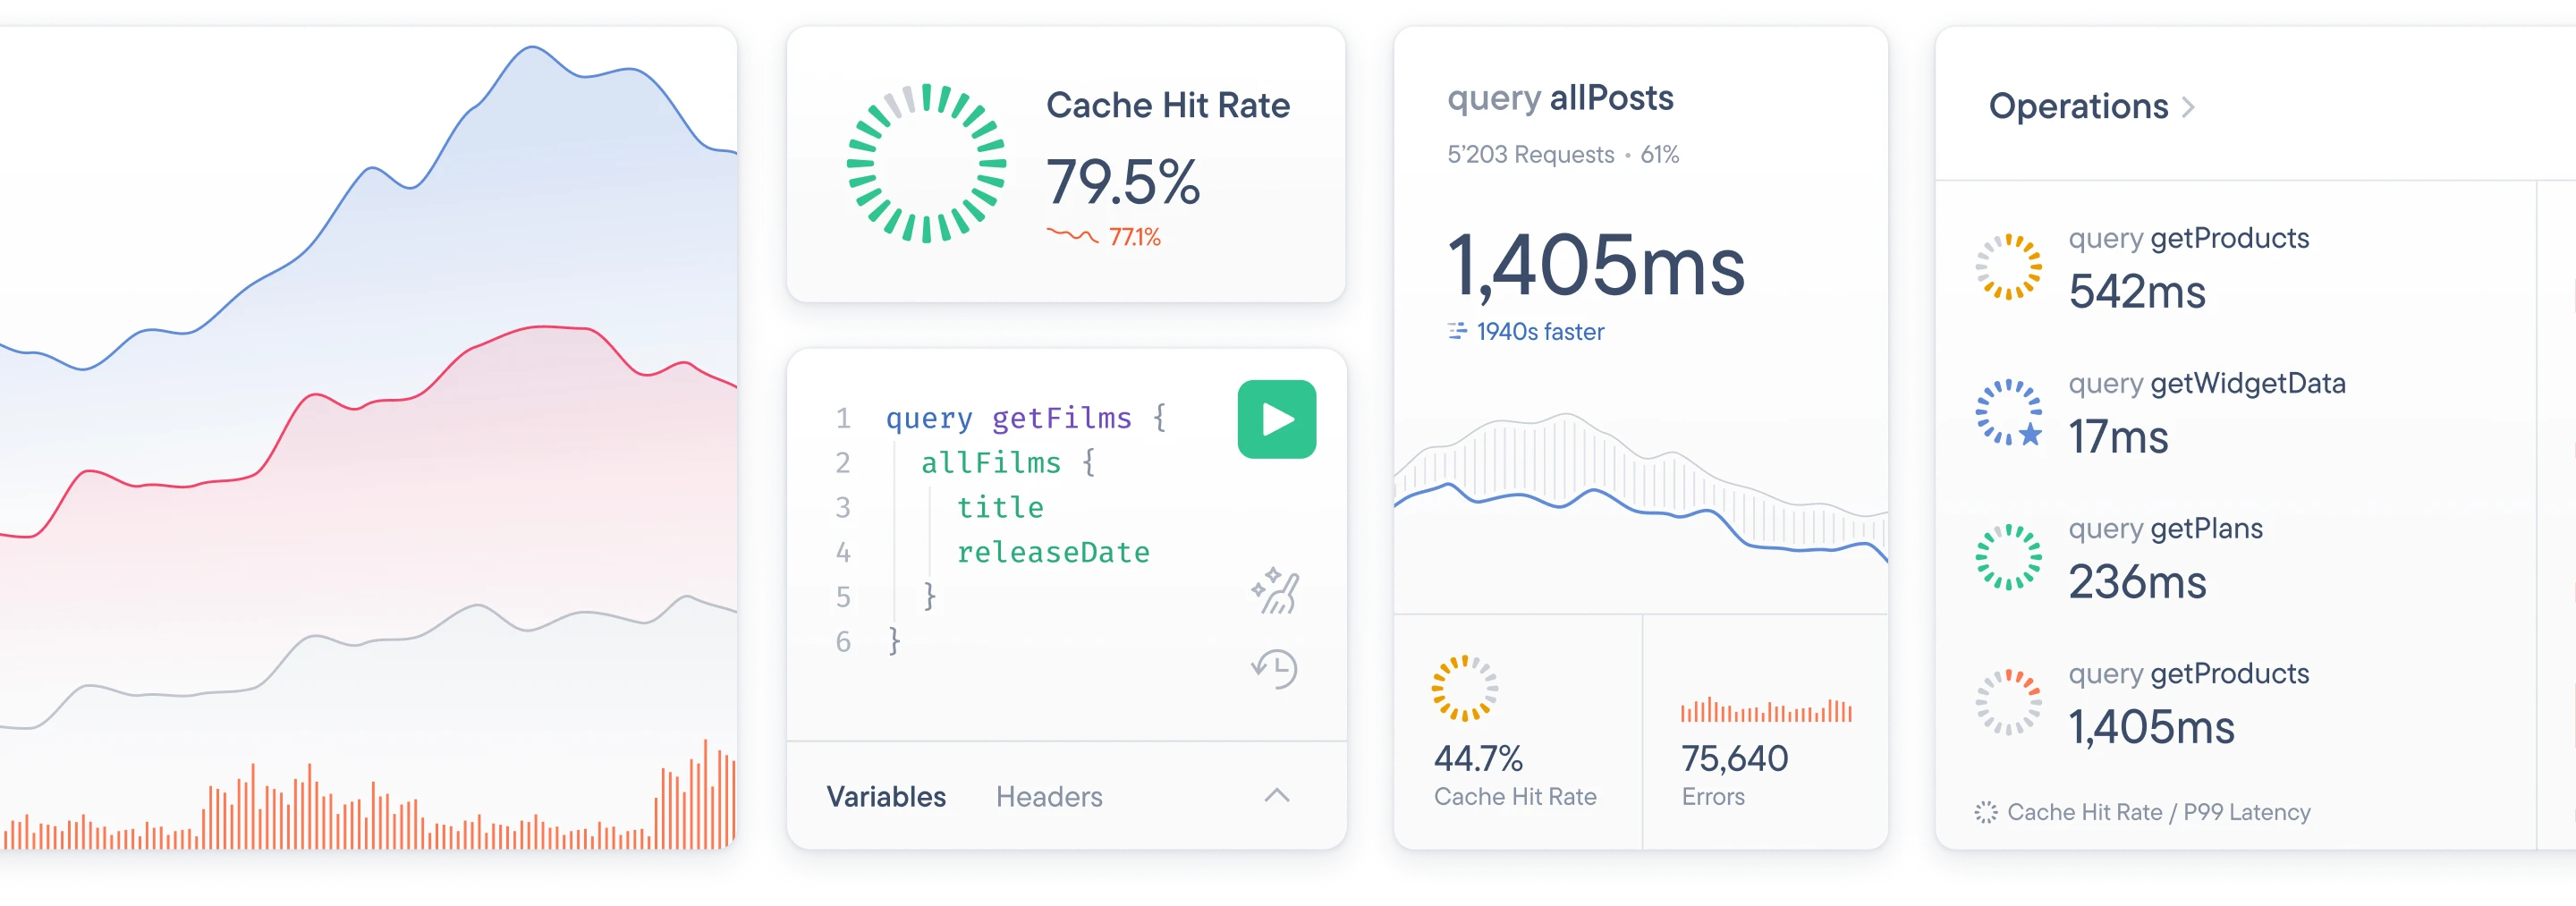
Get visibility into every single query and mutation sent to your GraphQL API, including the request’s headers, latency, errors, and more.

Automatically oversee the performance of your GraphQL API down to the individual operation level to identify your biggest bottlenecks.

Track all HTTP and GraphQL errors and receive alerts on spikes the moment they become a problem for your users.
Deep dive into your data at minute-level accuracy, aid your debugging process, and inform decision-making.

Analyze operations cardinality to identify areas for caching improvements to boost Cache Hit Rate across all operations.

Track data points with each GraphQL request with Custom Attributes. Make your metrics multi-tenant and enhance user journey debugging. Your API insights, personalized.

Get even more granularity while performing analysis when investigating poor performance or errors. Identify fields that are the least used or get a better understanding of how big of an impact an error is with your users. Dive even further within your analysis by the GraphQL client version.
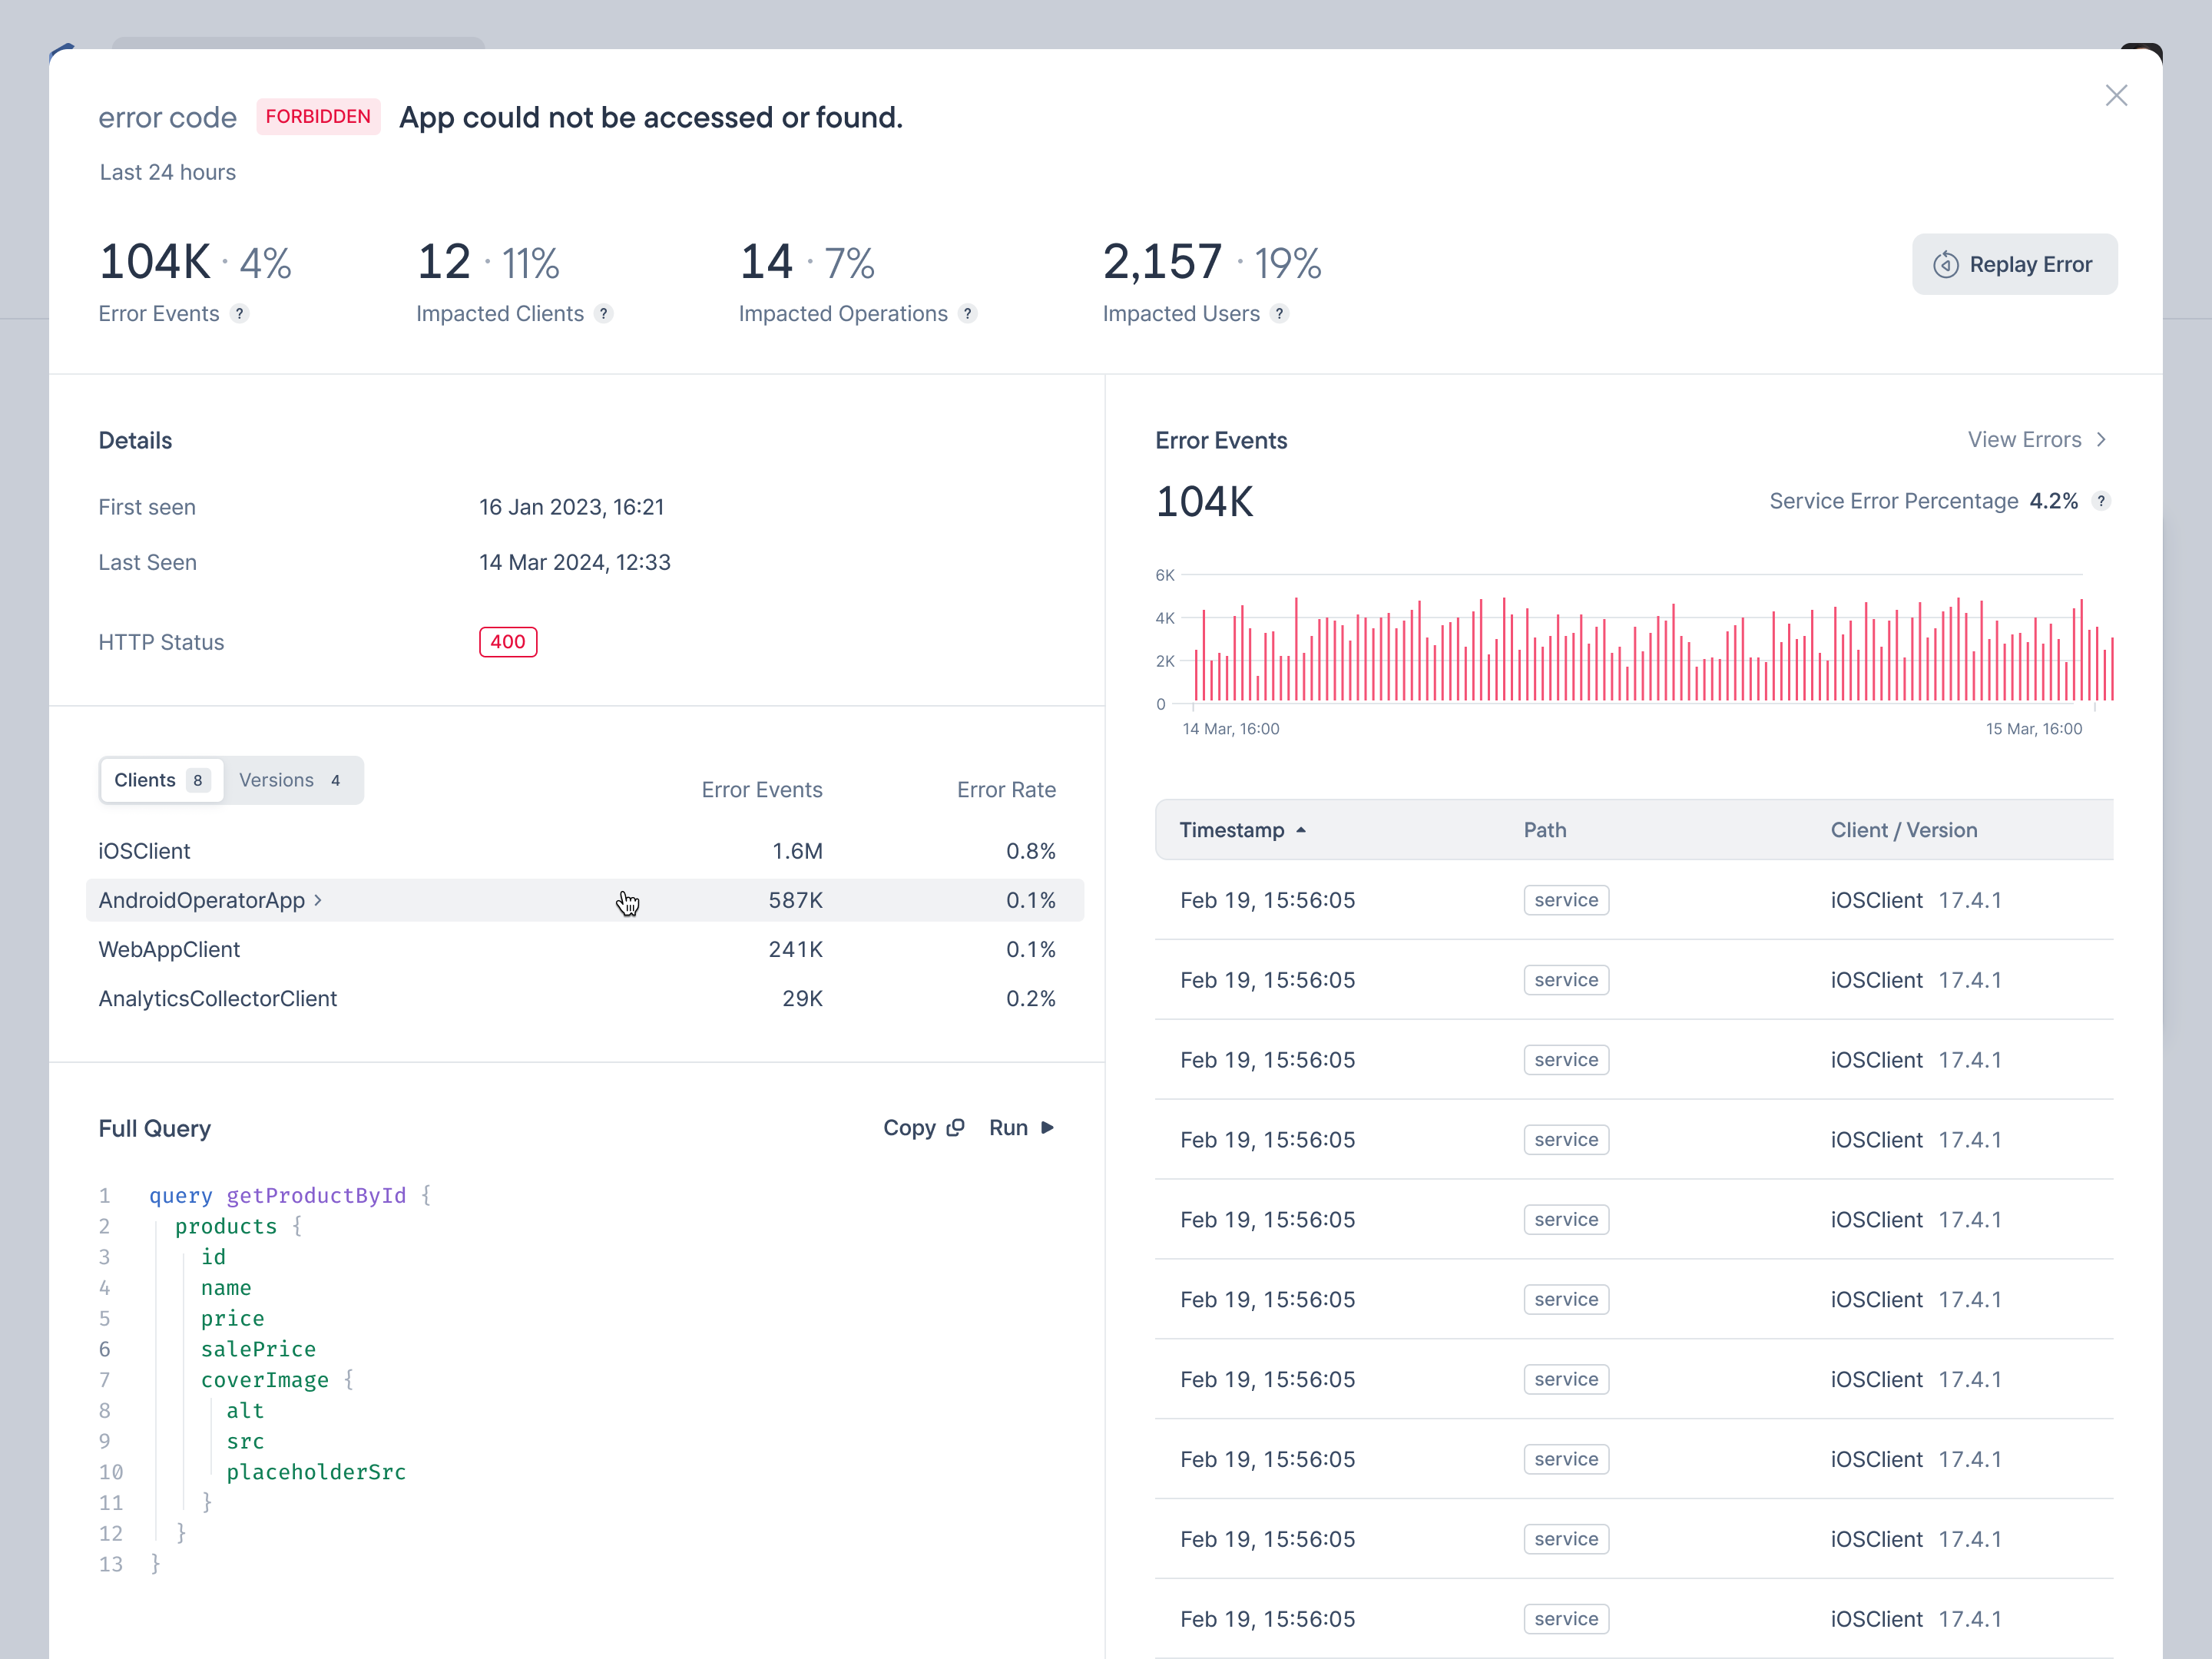
Instrument and replay the errors directly from Stellate. Re-run the original request using its original variables. Requesting your users to reproduce the errors is a thing of the past.

Filter your metrics down to the nuances. Check the performance of certain operations or discover how certain HTTP referrers cause errors.

Notify the right people over the right channel when things go wrong. Use the Slack and PagerDuty integrations or good old email.

Identify unused fields and types and prevent breaking changes to your schema based on actual usage data from your users.

Set up Stellate in less than 5 minutes to unlock the full potential of your GraphQL API.