Announcing Purging Analytics for Our GraphQL Edge Cache: Full Visibility into Your Cache Invalidation
Serving stale data from the cache is the main risk you have to deal with when adding caching to your stack. Any cache is conceptually a copy of your data in another location, and making sure those two copies don’t diverge isn’t always straightforward — particularly with edge caching, where you have 70+ copies of various pieces of data cached around the globe.
That’s why one of the most important features that our GraphQL Edge Cache offers is our super-fast fine-grained cache invalidation based on GraphQL types & fields.
The Benefits of Stellate's Super-Fast Fine-Grained Cache Invalidation
For example, when the Invoice with the ID inv-123 changes (whether because of a GraphQL mutation or because you manually ping the Purging API), any cached query result that contains that specific Invoice will be purged in 150ms globally.
Yes, you read that right: it takes 150 milliseconds to purge any cached query result that contains a specific GraphQL object from our 68 edge locations globally.
150 milliseconds. 68 edge locations globally.
There are many use cases where data being stale for seconds or even minutes after purging or until the TTL expires isn’t acceptable. That’s why this super-fast, fine-grained cache invalidation enables you to cache a lot more of their data than if you only had access to TTL-based expiration and/or slower cache purging.
Super-fast fine-grained cache invalidation is great, but how do you know whether it’s invalidating the right data? And how do you verify that it isn’t reducing your cache hit rate by purging queries that don’t even need to be purged?
Purging Analytics for Our GraphQL Edge Cache
As part of the new dashboard that we’ve released this week, Stellate’s new GraphQL Metrics also tracks all of your cache purging! 🎉
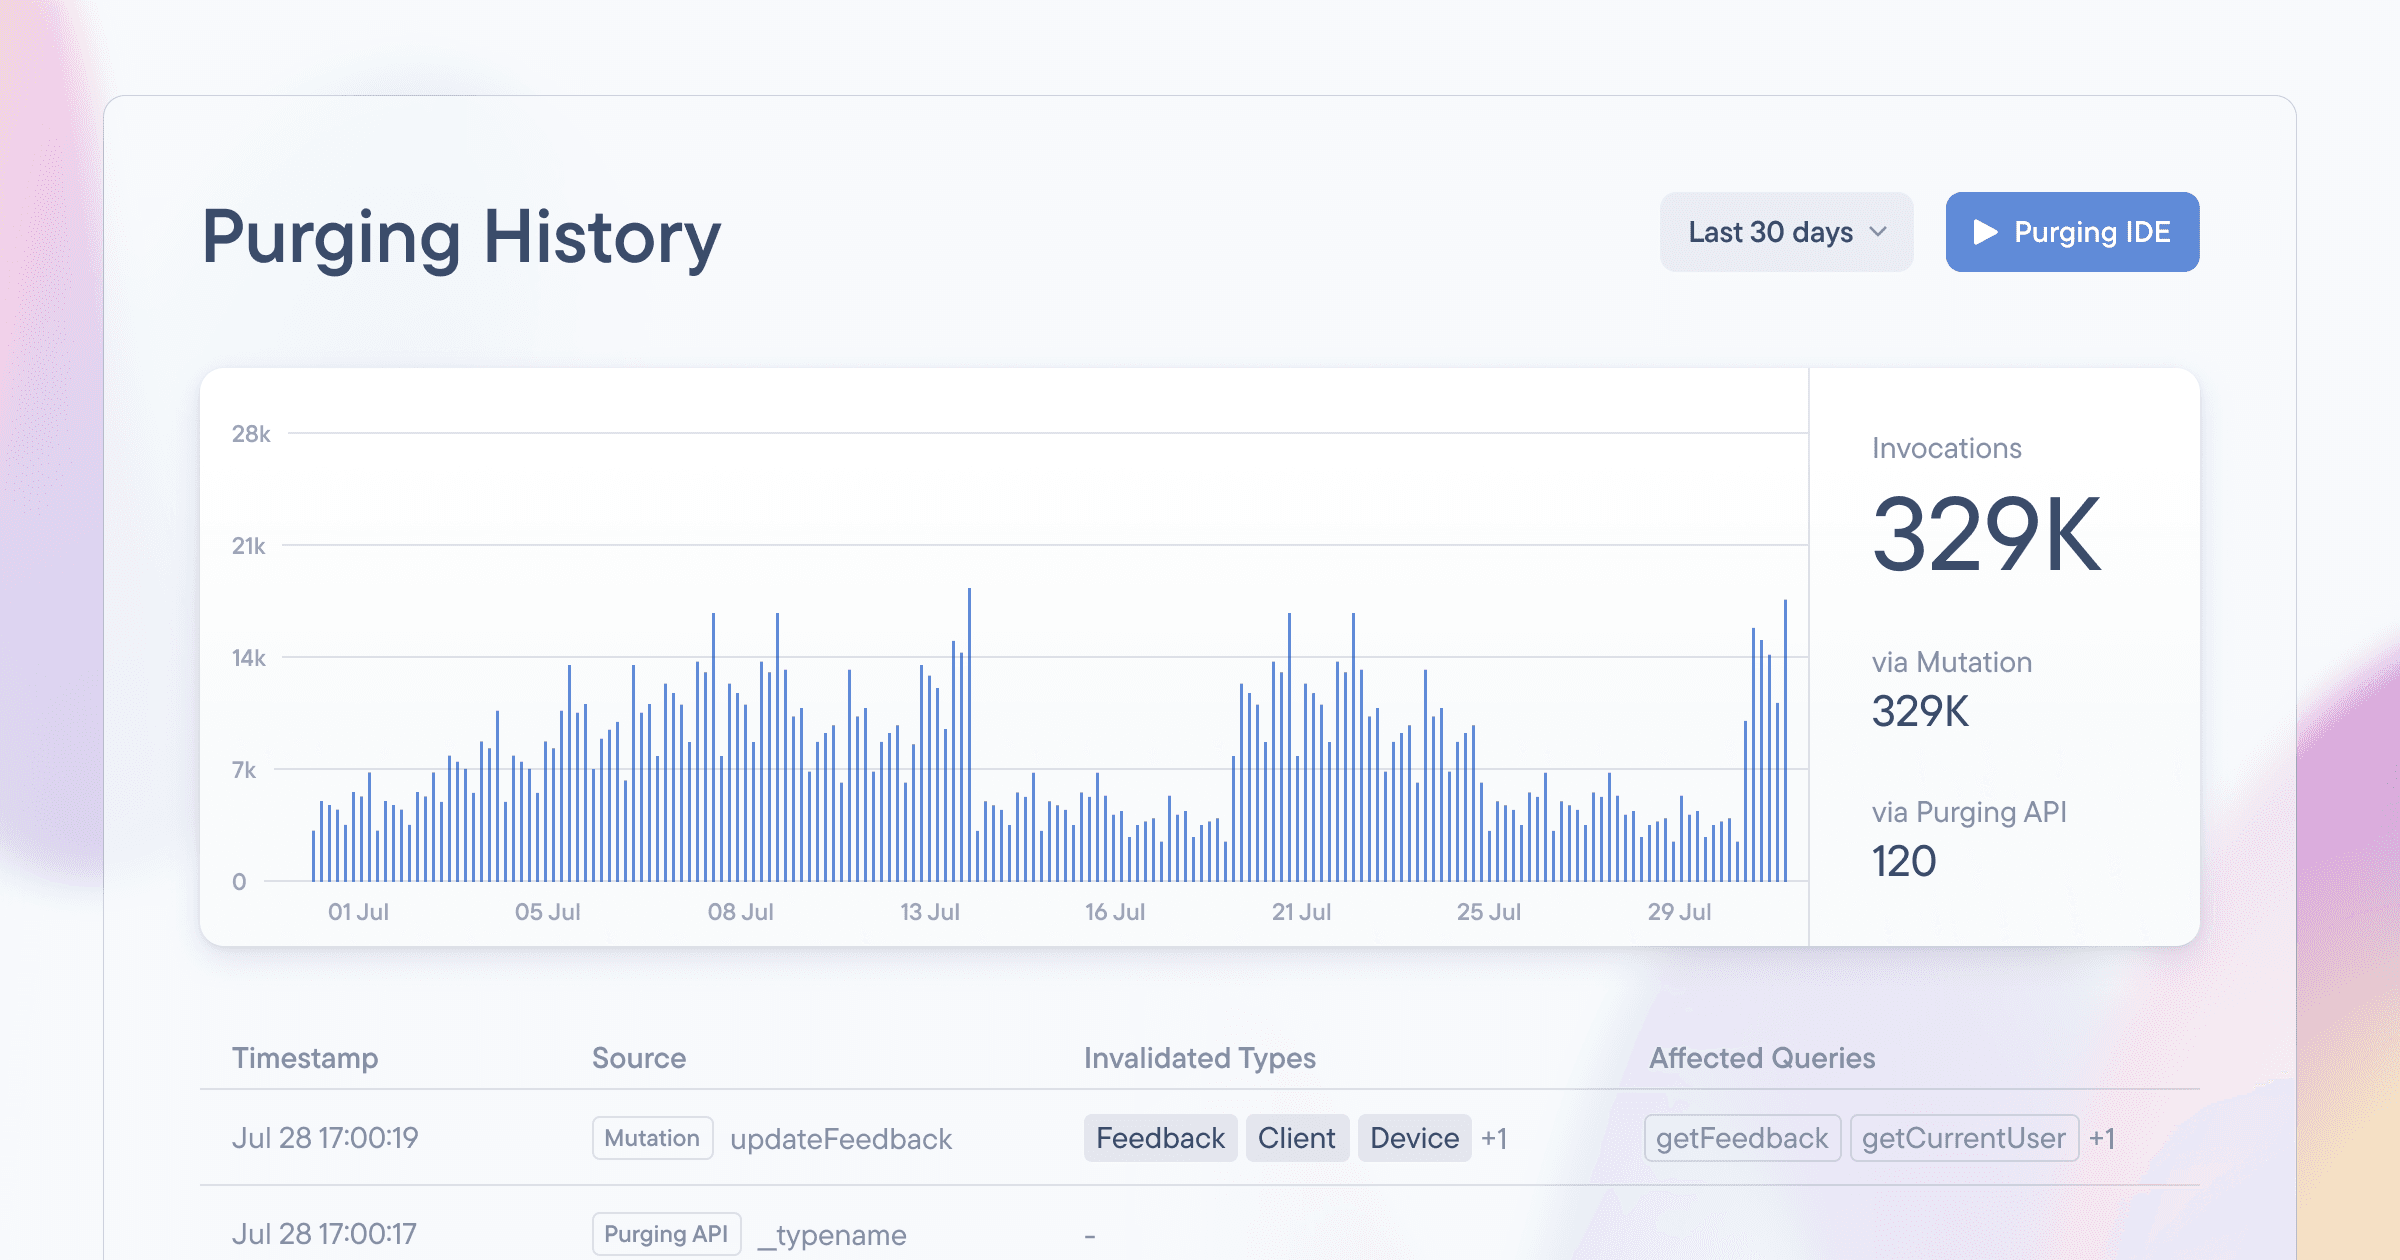
Whether data is purged because of an automatic mutation invalidation or because there was a call to the Purging API, our purging analytics give you full visibility into what was invalidated and why:
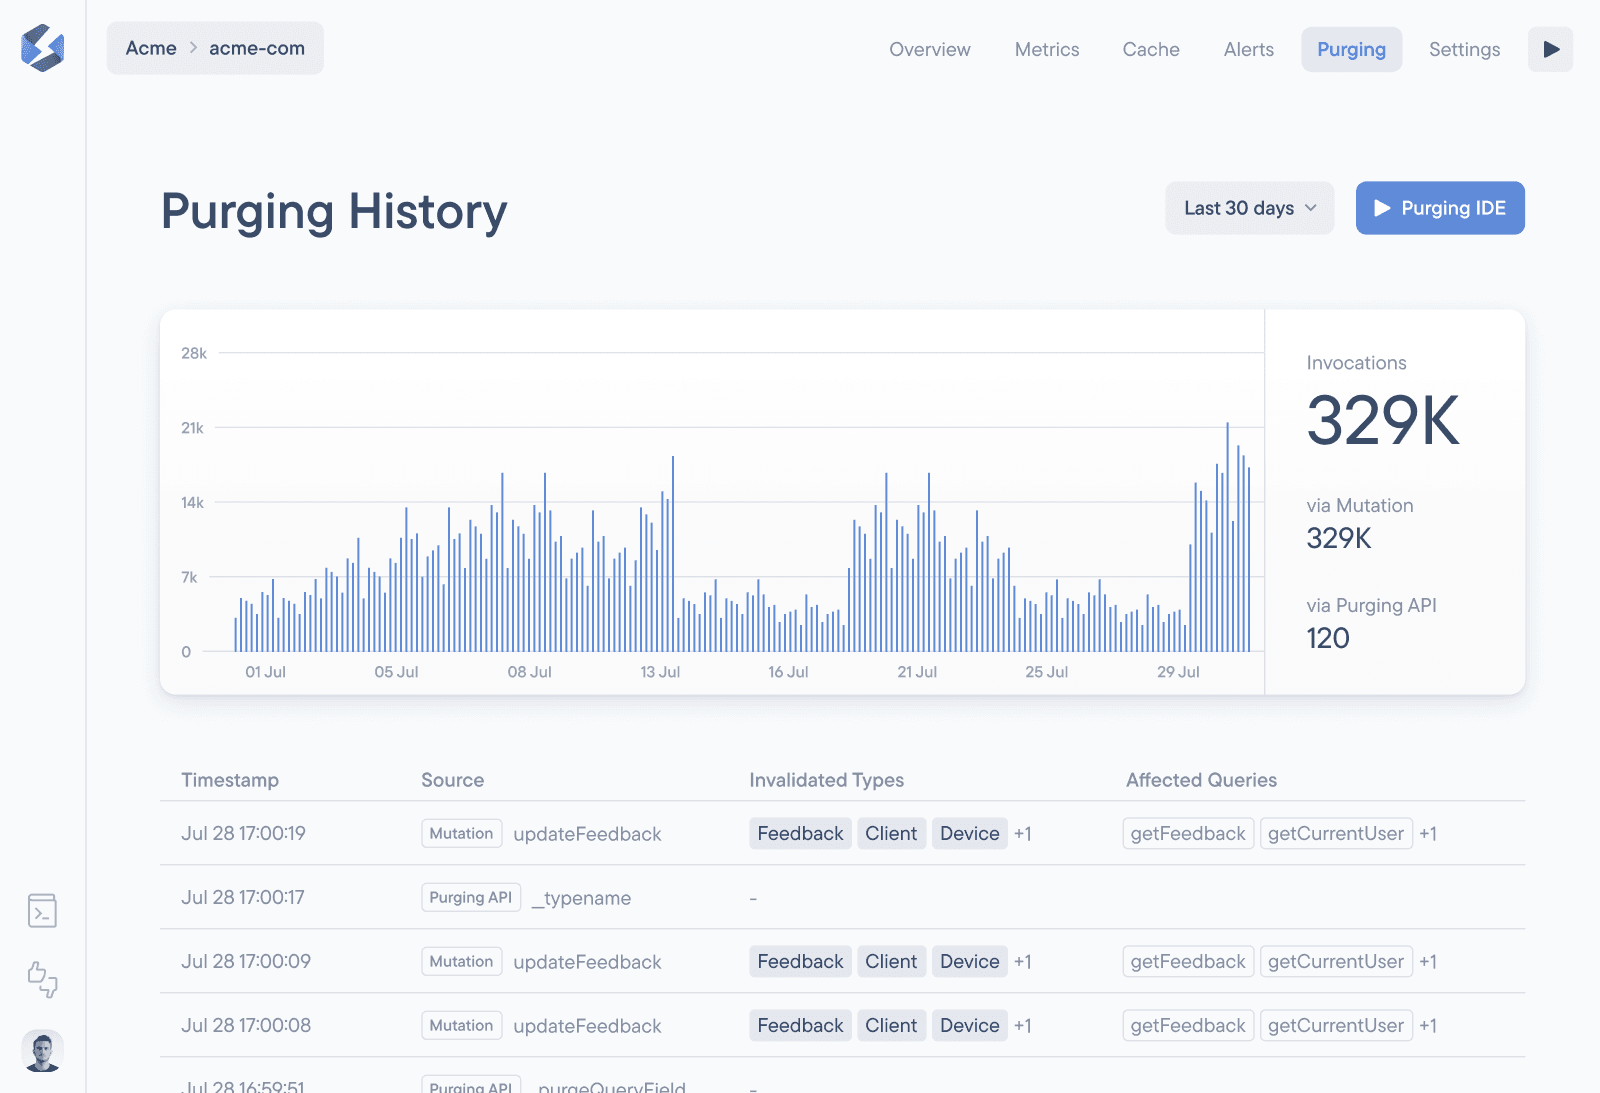
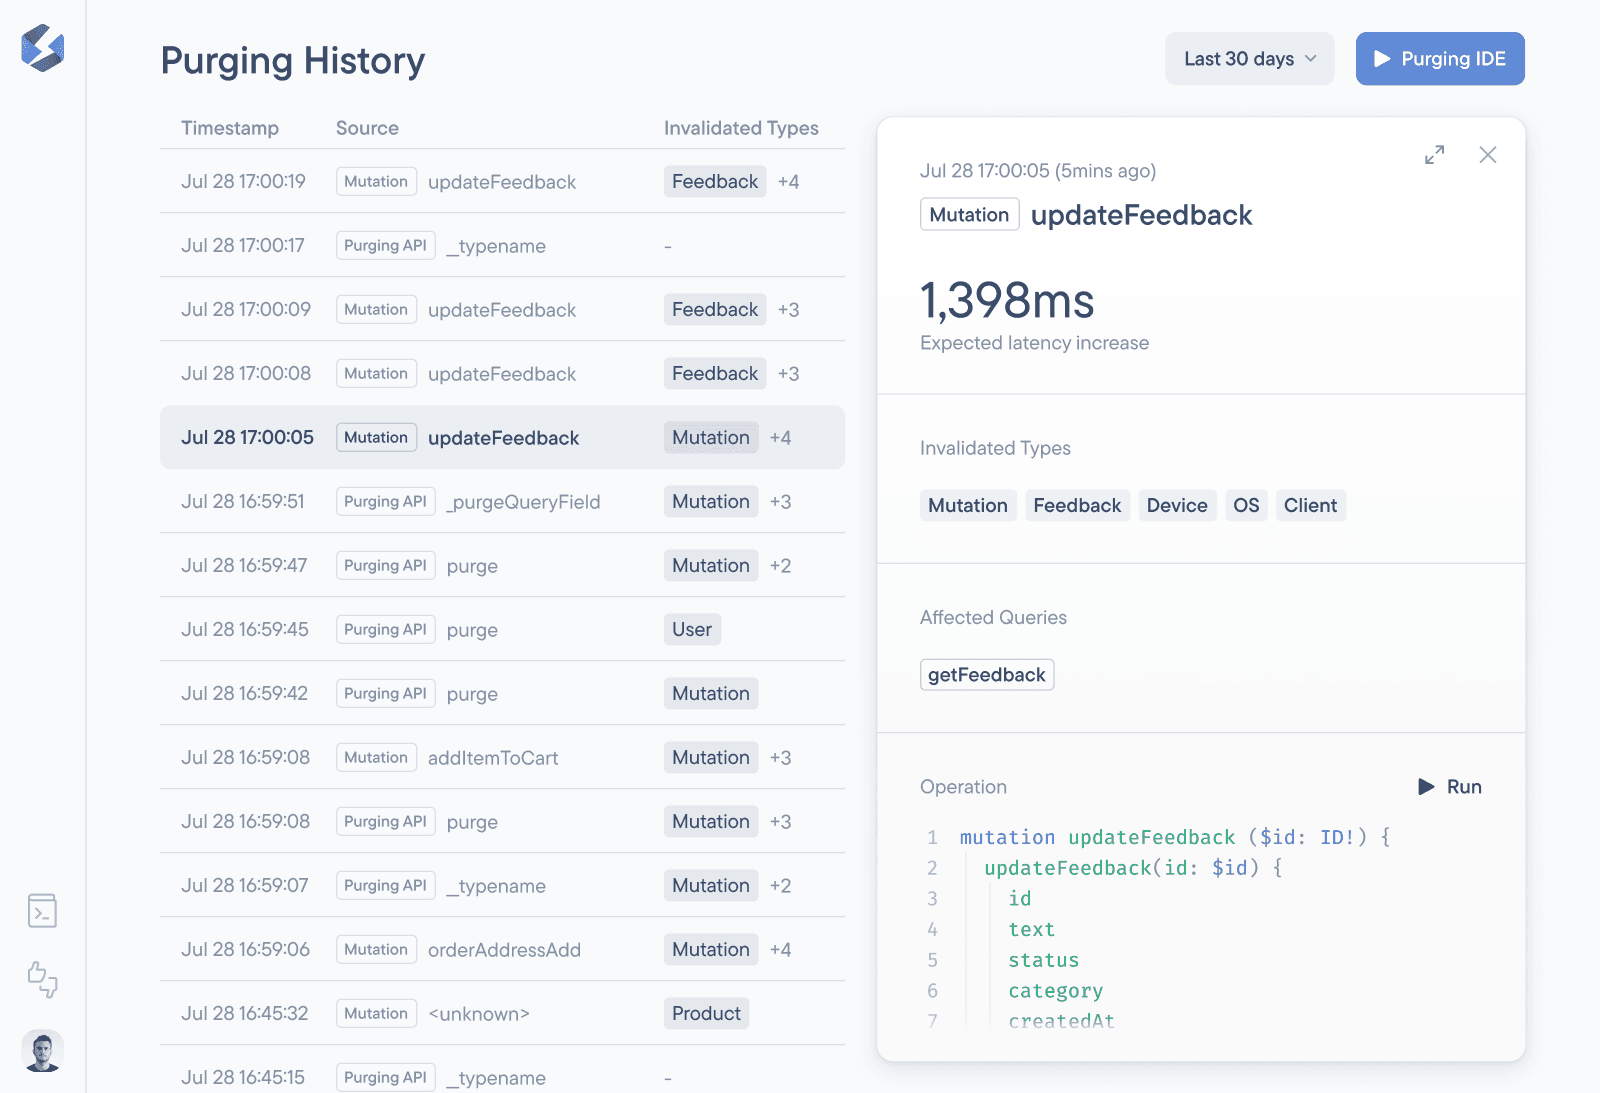
We track every single purge that happens, why it happened (whether from an automatic mutation invalidation or the Purging API), which types and queries it purged, and whether it failed or was successful. We also calculate the “Expected p95 latency increase” for the queries that were affected based on the cold p95 origin response time from your API for those specific queries:
With our new purging analytics, you get full visibility into your cache’s activity, which allows you to further optimize your cache hit rate and have the confidence that no stale data is served to your users.
Wrapping Up
While we’re focused on announcing the rest of the changes this week, you already have access to our new Purging Analytics today! If you’re not already a Stellate user or are currently using a GraphQL caching solution where you don’t have visibility into what’s being invalidated, sign up for free and take a look at them today.