About 3 months ago, we were hanging out in Mexico City for an engineering offsite. During one of our work sessions, we started talking about caching, and we had this idea of showing users what their Maximum Cache Hit Rate (Max CHR) was, so it was easier to know their potential limit and optimize their services.
The Max CHR was a great tool to show what is potentially possible. But that opened another set of questions. How do we actually get there? What are the highest-impact operations? What insights are necessary to improve your cache performance in a data-informed way? We went down the rabbit hole.
We started evaluating our platform and took a hard look at the insights and data we provide to optimize the cache hit rate. We noticed many areas of improvement. We didn't feel we had enough actionable insights and data to make it simple and quick to optimize the cache hit rate. This was the time when we set out to change that. It became our mission to provide actionable insights into how to best optimize the cache hit rate.

Since then, we have shipped many small and big improvements to the caching experience, including a brand new Caching Metrics page that went live today 🎉.
Here is how you can optimize your cache hit rate with the recent features and improvements we shipped.
Caching Metrics
When we want to know how our cache is performing, the most common metric to look at is Cache Hit Rate (CHR). We define this metric as follows:
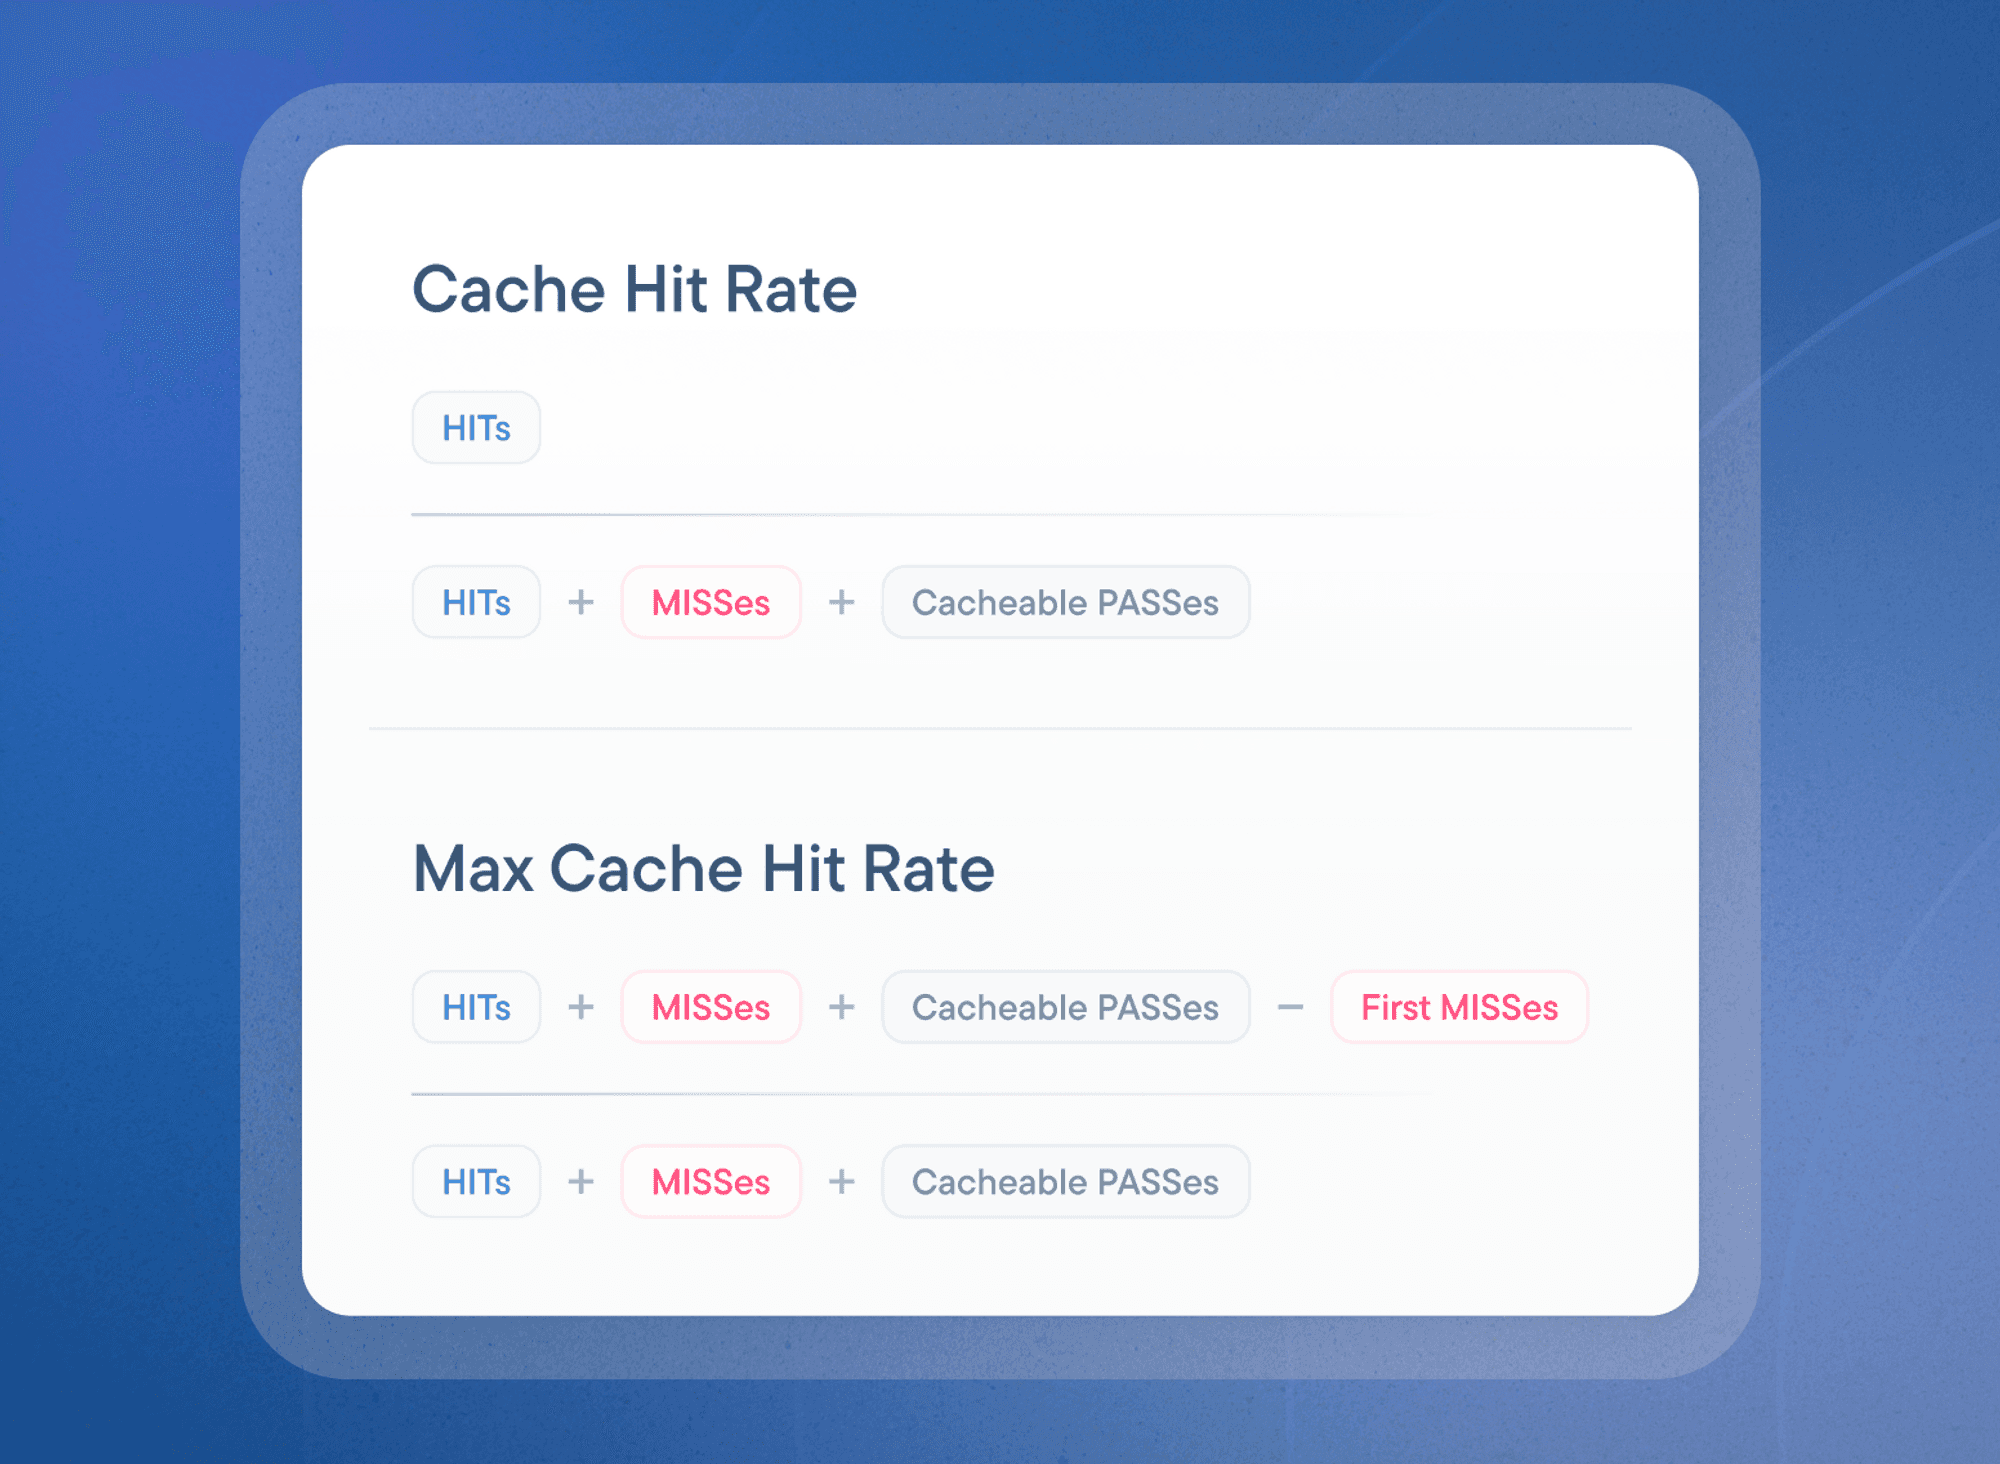
This metric will tell you how many hits you have, compared against all of your cacheable traffic. Previously this was the only caching metric we would show, but after some internal product research and work, we defined 3 additional metrics:
Max CHR: The maximum CHR achievable by your service. We calculate this by looking at your traffic, and then computing the different combinations of GraphQL variables, responses, and a few other fields that affect our caching, and then computing how many different caching buckets you would need, and with this we can get that maximum percentage.
Uncached bandwidth: This metric tells you how much of the traffic that goes to Stellate ends up going to your backend, the more traffic you cache the smaller this number will get. You can use this to estimate how much money you are saving on bandwidth.
CHR Impact: This metric will tell you what is the percentage gain from optimizing a specific operation CHR. This is like saying “optimizing the
getUsersquery CHR will yield at most 11% in the overall service cache hit rate”.
Using these metrics, you can better understand how your cache is performing, and how far can you go, helping you to take caching decisions and make it easier to see where to spend your efforts in what to cache next. We used these to build charts that will show you cache hit rate over time:
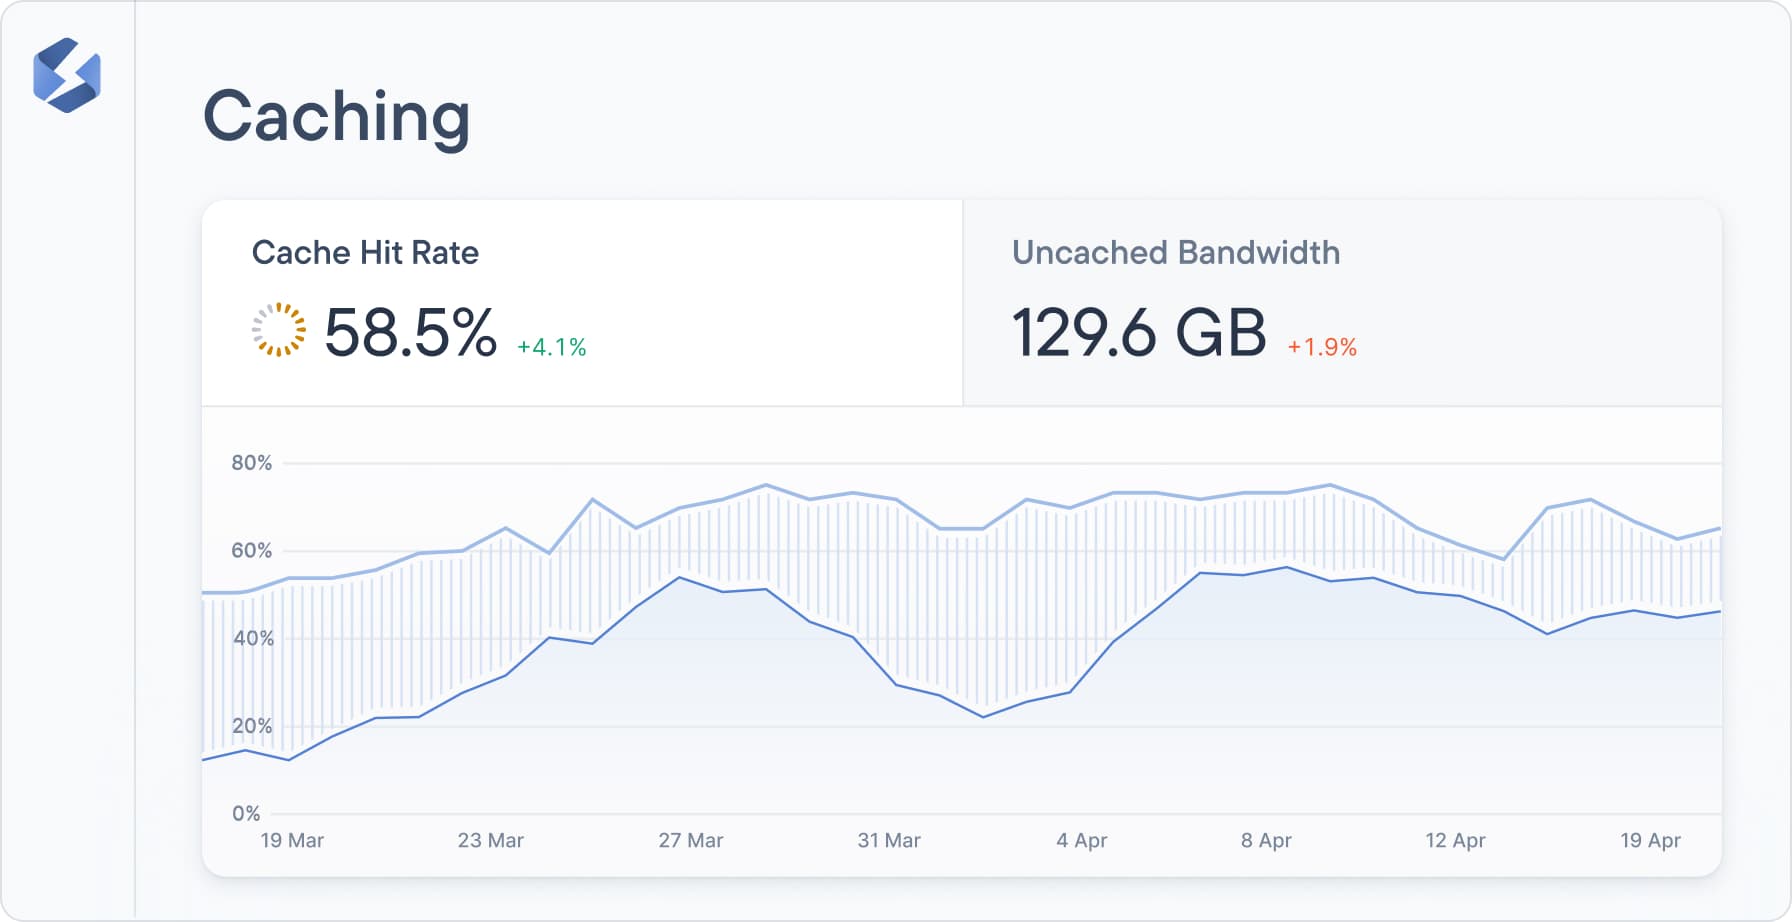
With this chart you will be able to correlate certain events to drops or increases in CHR, for example, next time you change your Stellate config or make a schema change in your API, you can come to this view and see how your cache behaves.
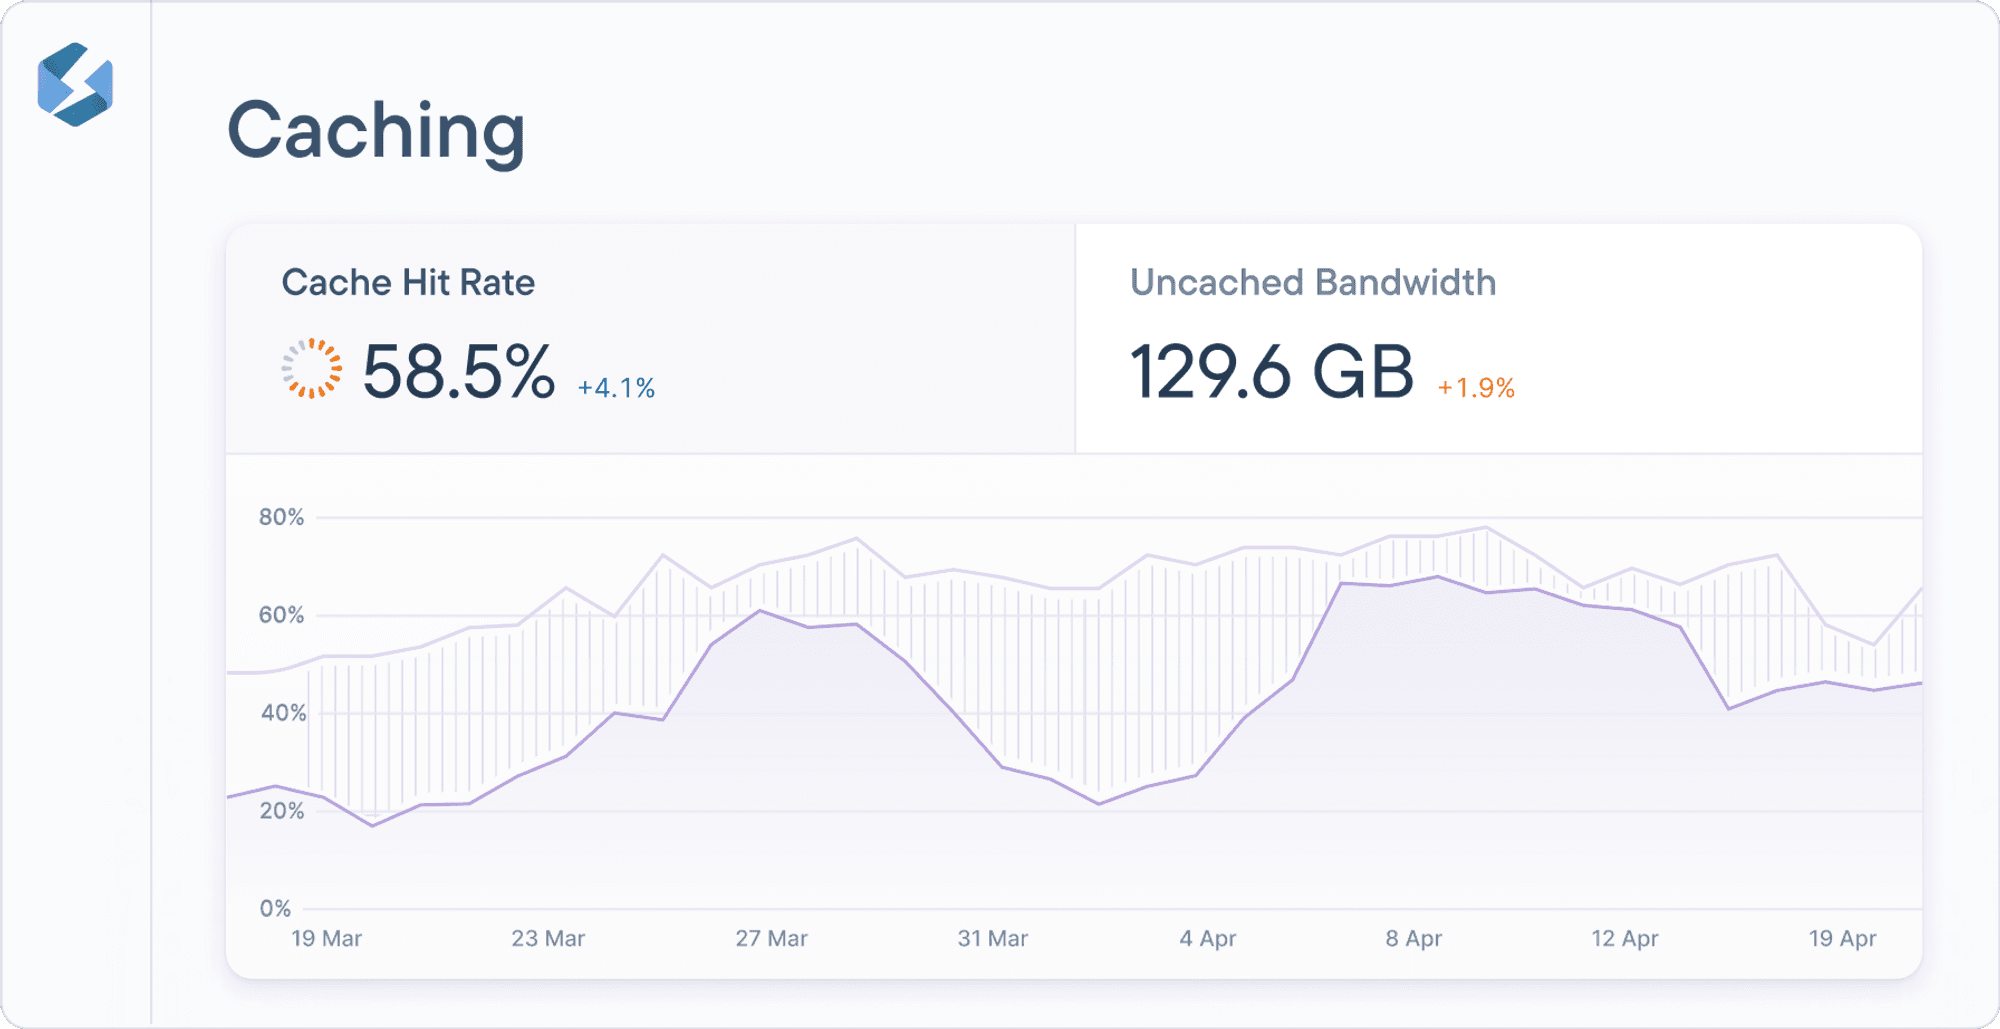
We also introduced another chart so you can estimate any cost savings, or understand how much bandwidth doesn’t up going through your backend thanks to Stellate’s edge cache:
Deciding where to optimize your cache hit rate
With a better understanding of caching metrics, the next step is deciding where to put our efforts. To make it easier to understand which operations have the highest potential to impact your cache hit rate, we added a caching opportunities table. Using this information, you understand what improvement you can expect when optimizing your caching for a specific operation.
In the image below, you can see the getAllBlogCollections operation has a CHR of 2.8%, but the Max CHR is actually 89.6%. If you were to optimize your service to cache this operation and take it closer to the Max CHR value, you can expect improvements of ~2.4% in your overall CHR.
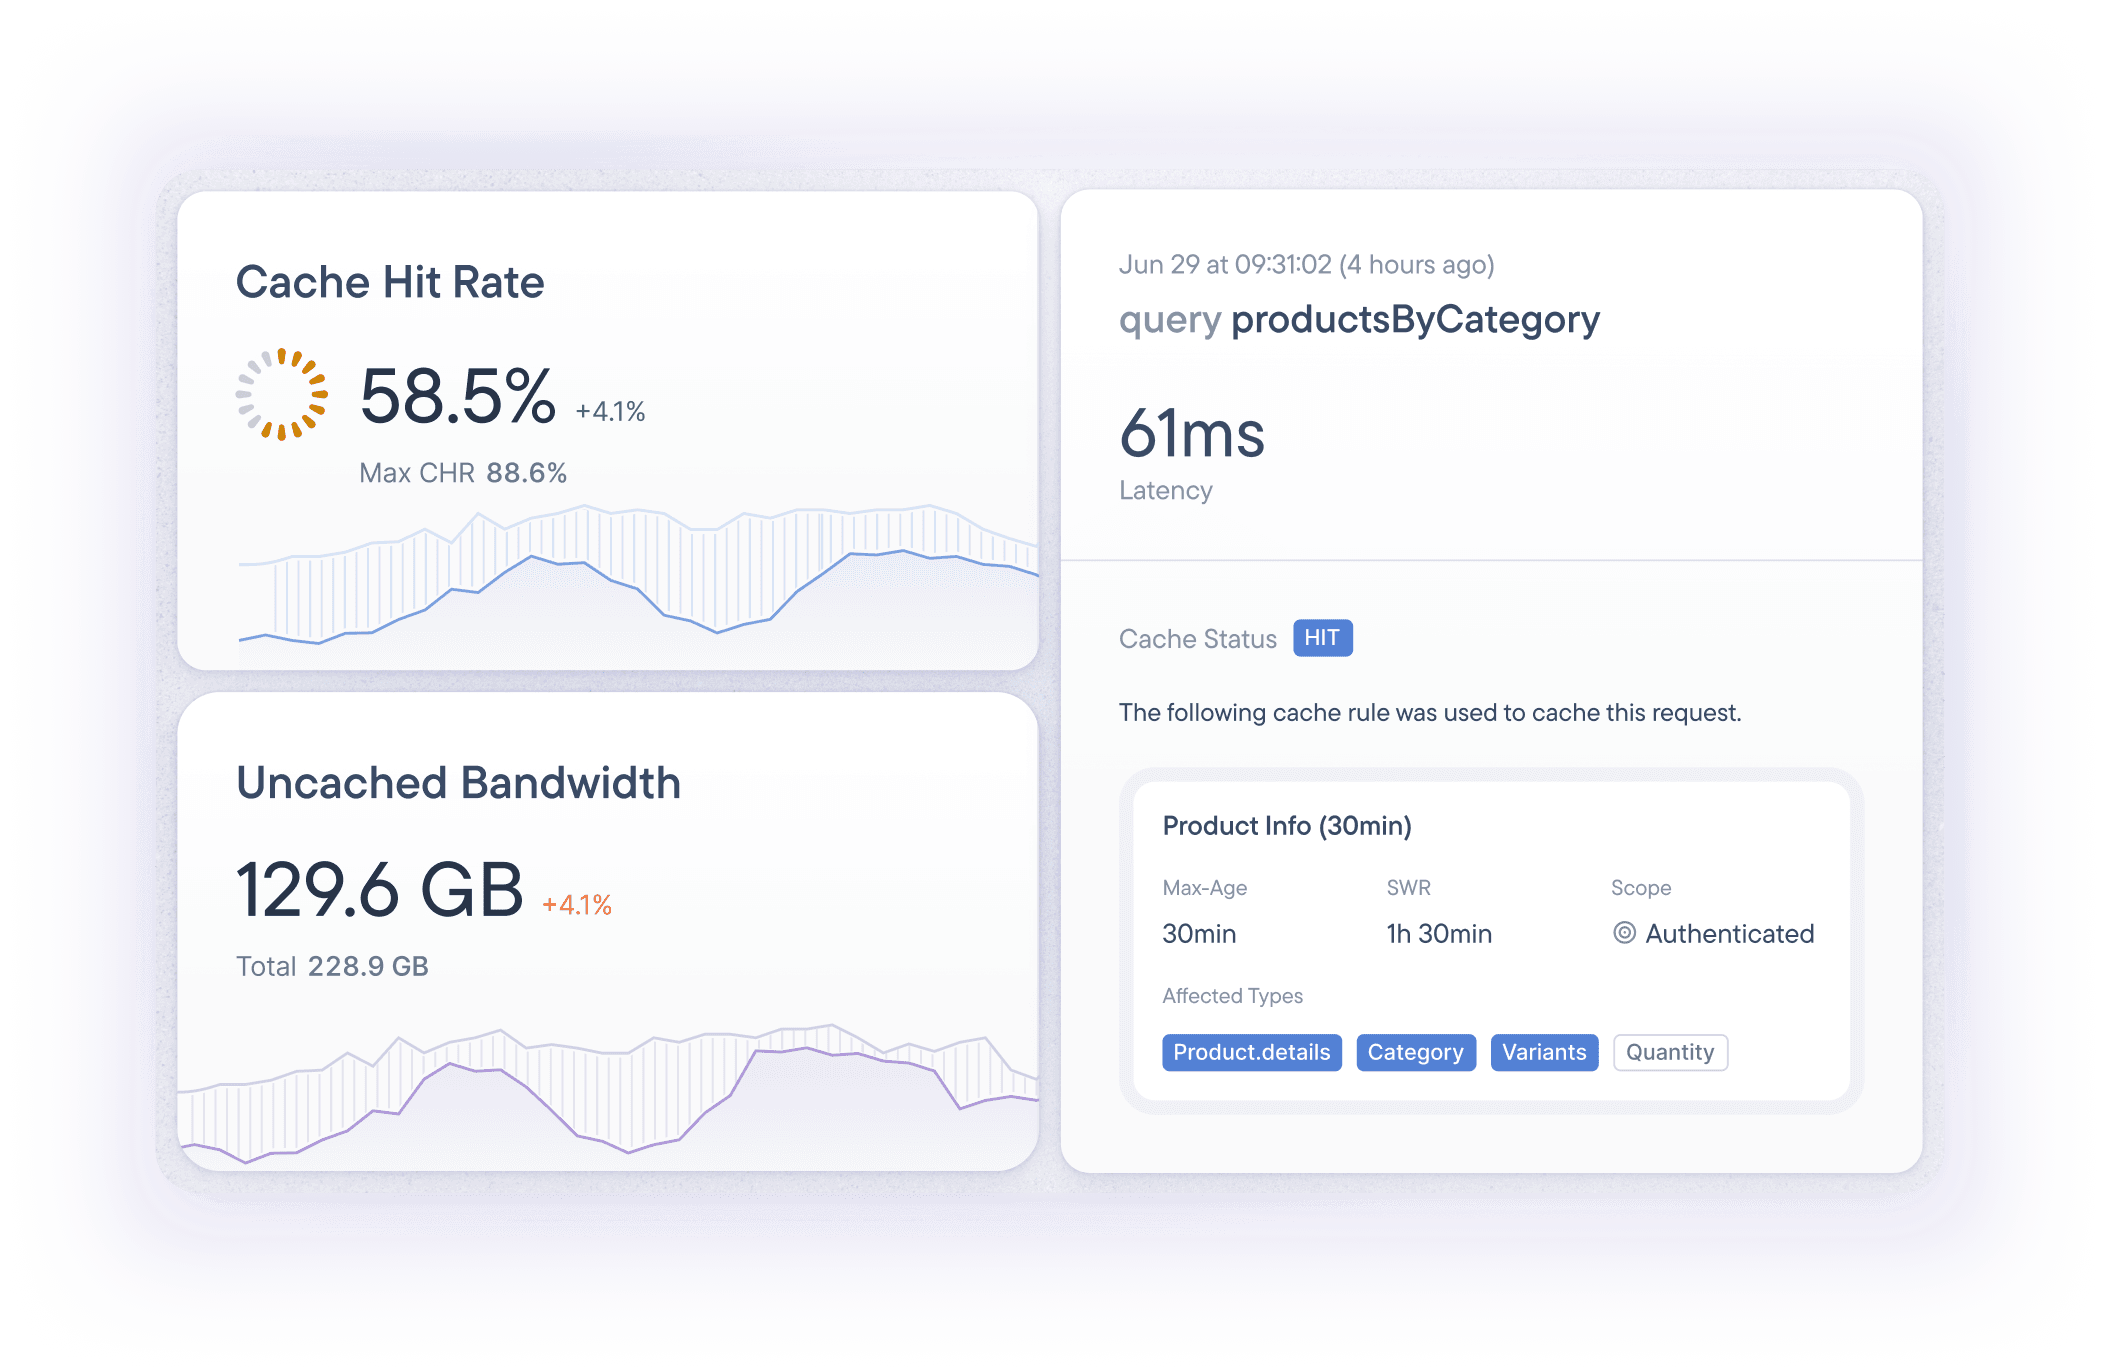
Debugging your Caching Rules
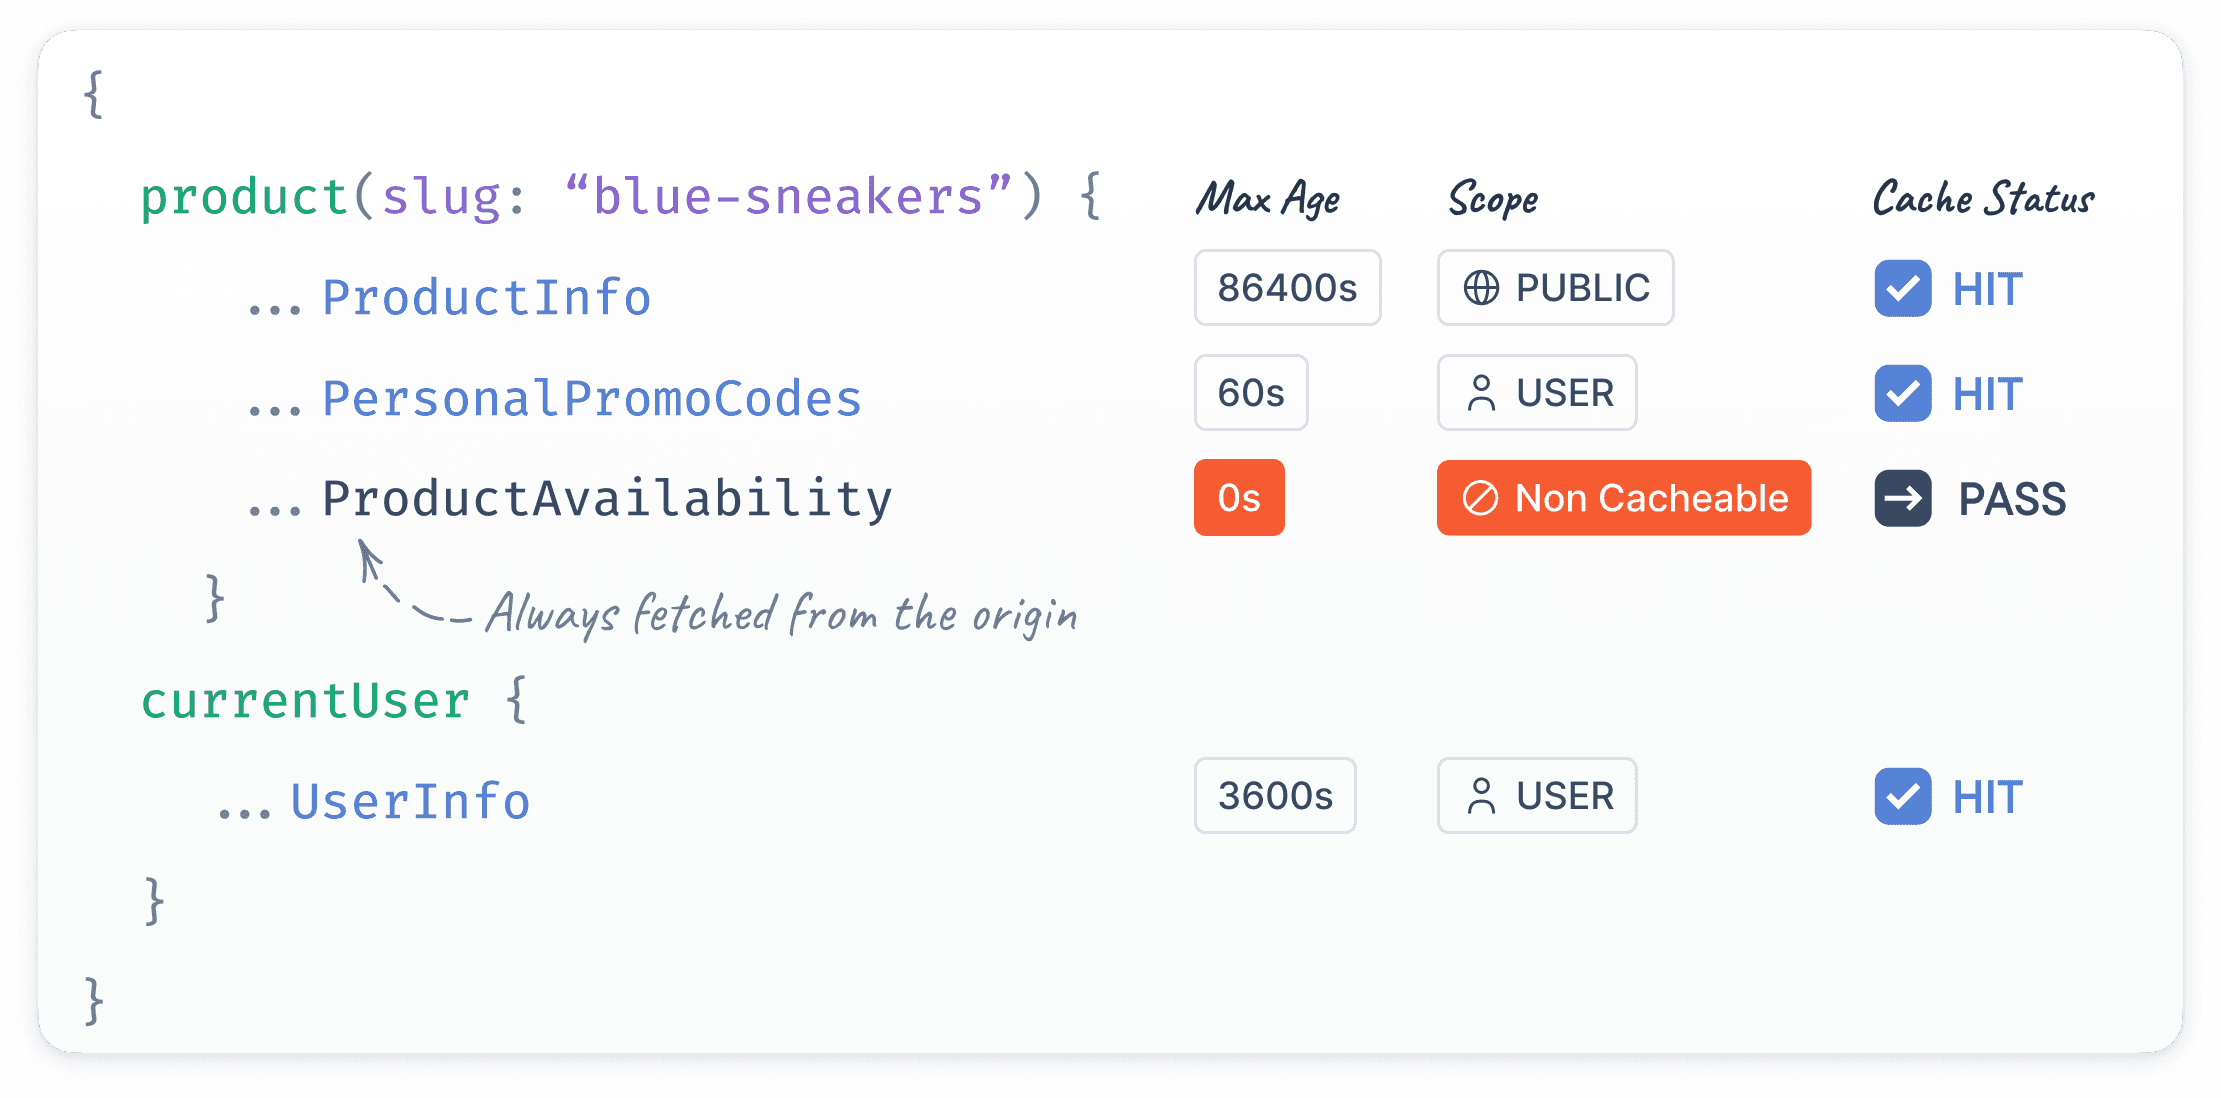
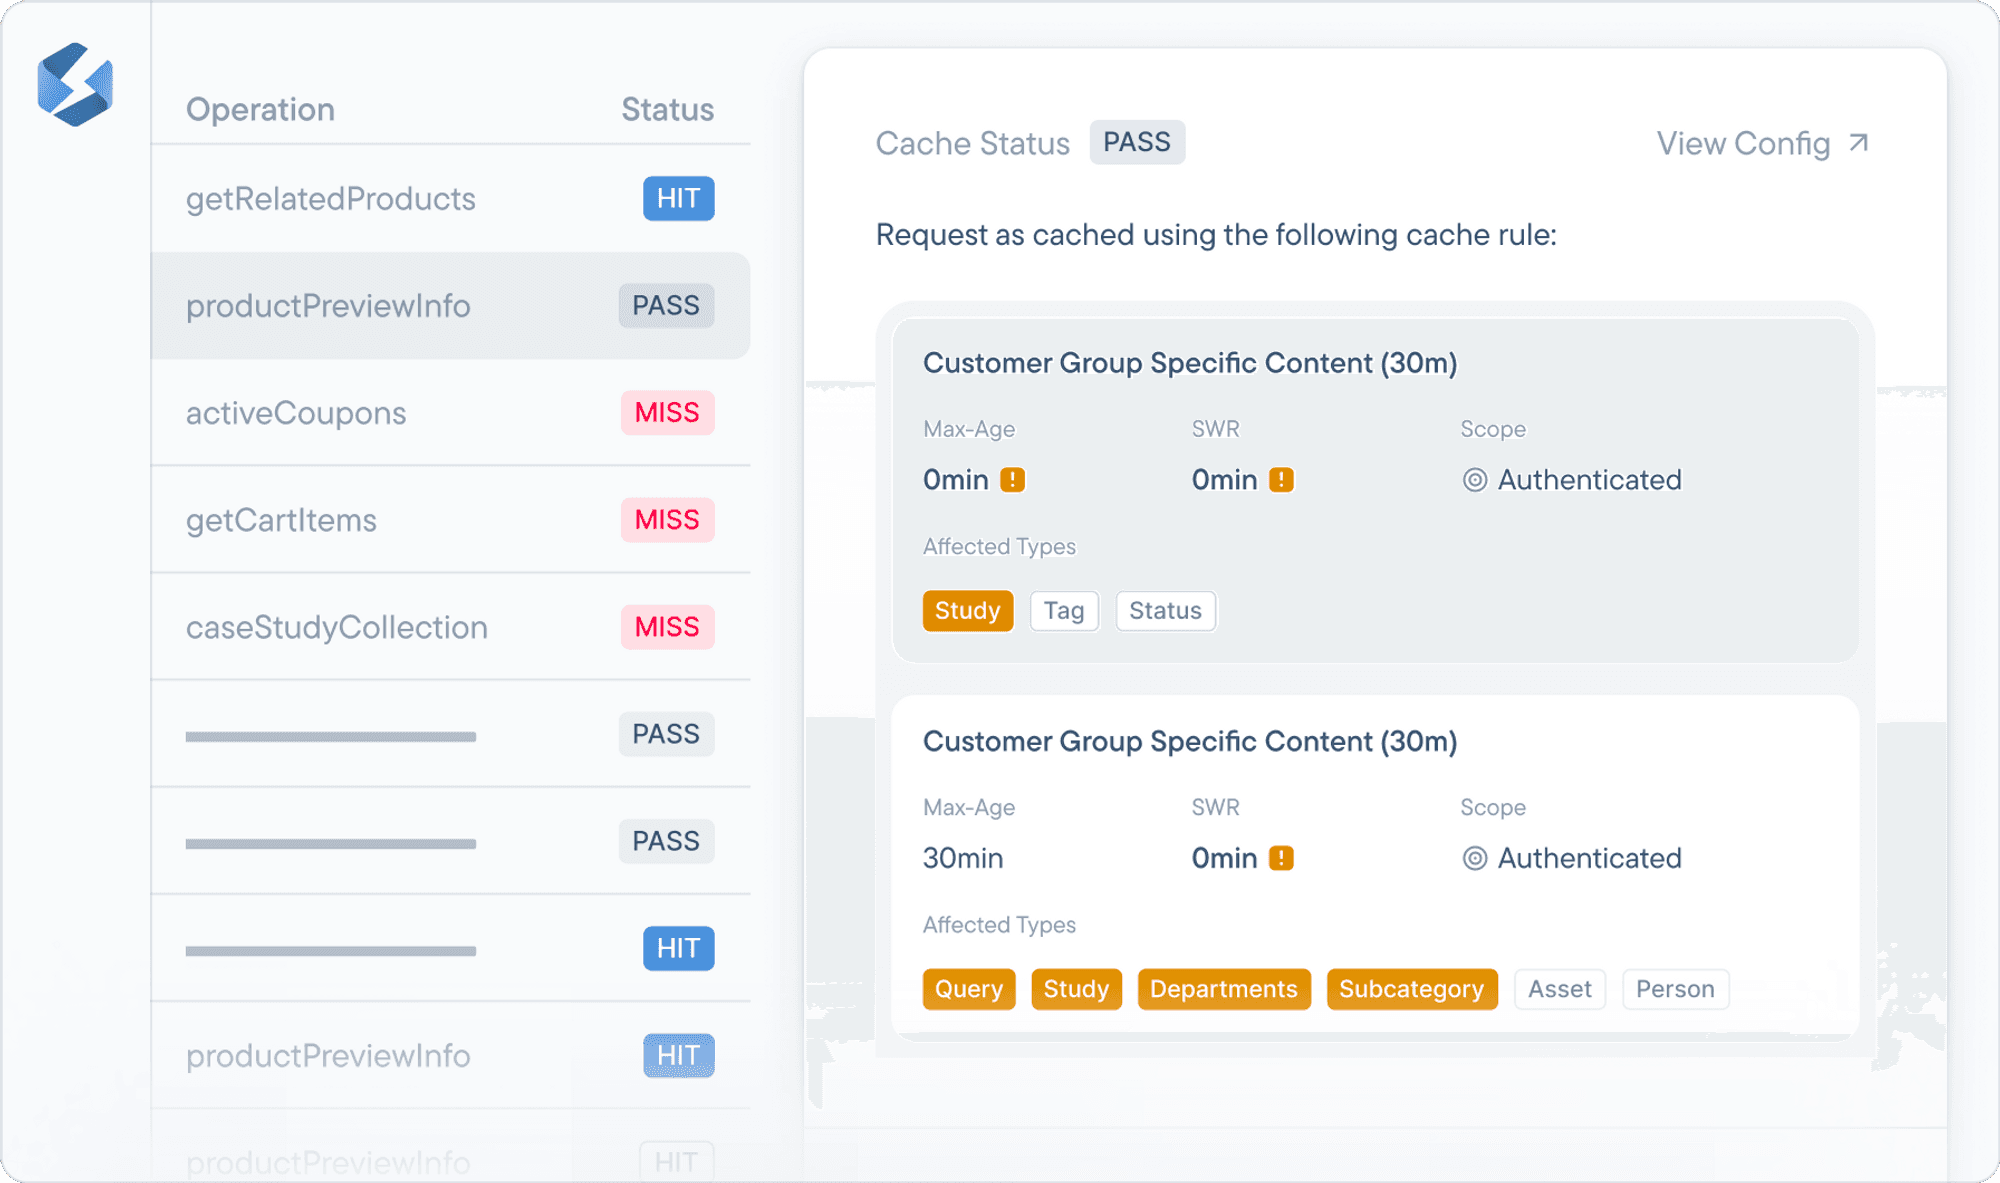
After you’ve gone and updated your Stellate config, the next step is observing the results. Whenever a request gets send to a Stellate service, the response will have an associated cache status, that can be either a hit, miss, or pass. The reason for these statuses can be associated with either your Stellate service configuration or with something present in the request.
We added a new section in the requests metrics to explicate the reason behind the cache status, so it is easier than ever to look at a request and understand how caching affected it, and understand what caching rules are affecting an operation.
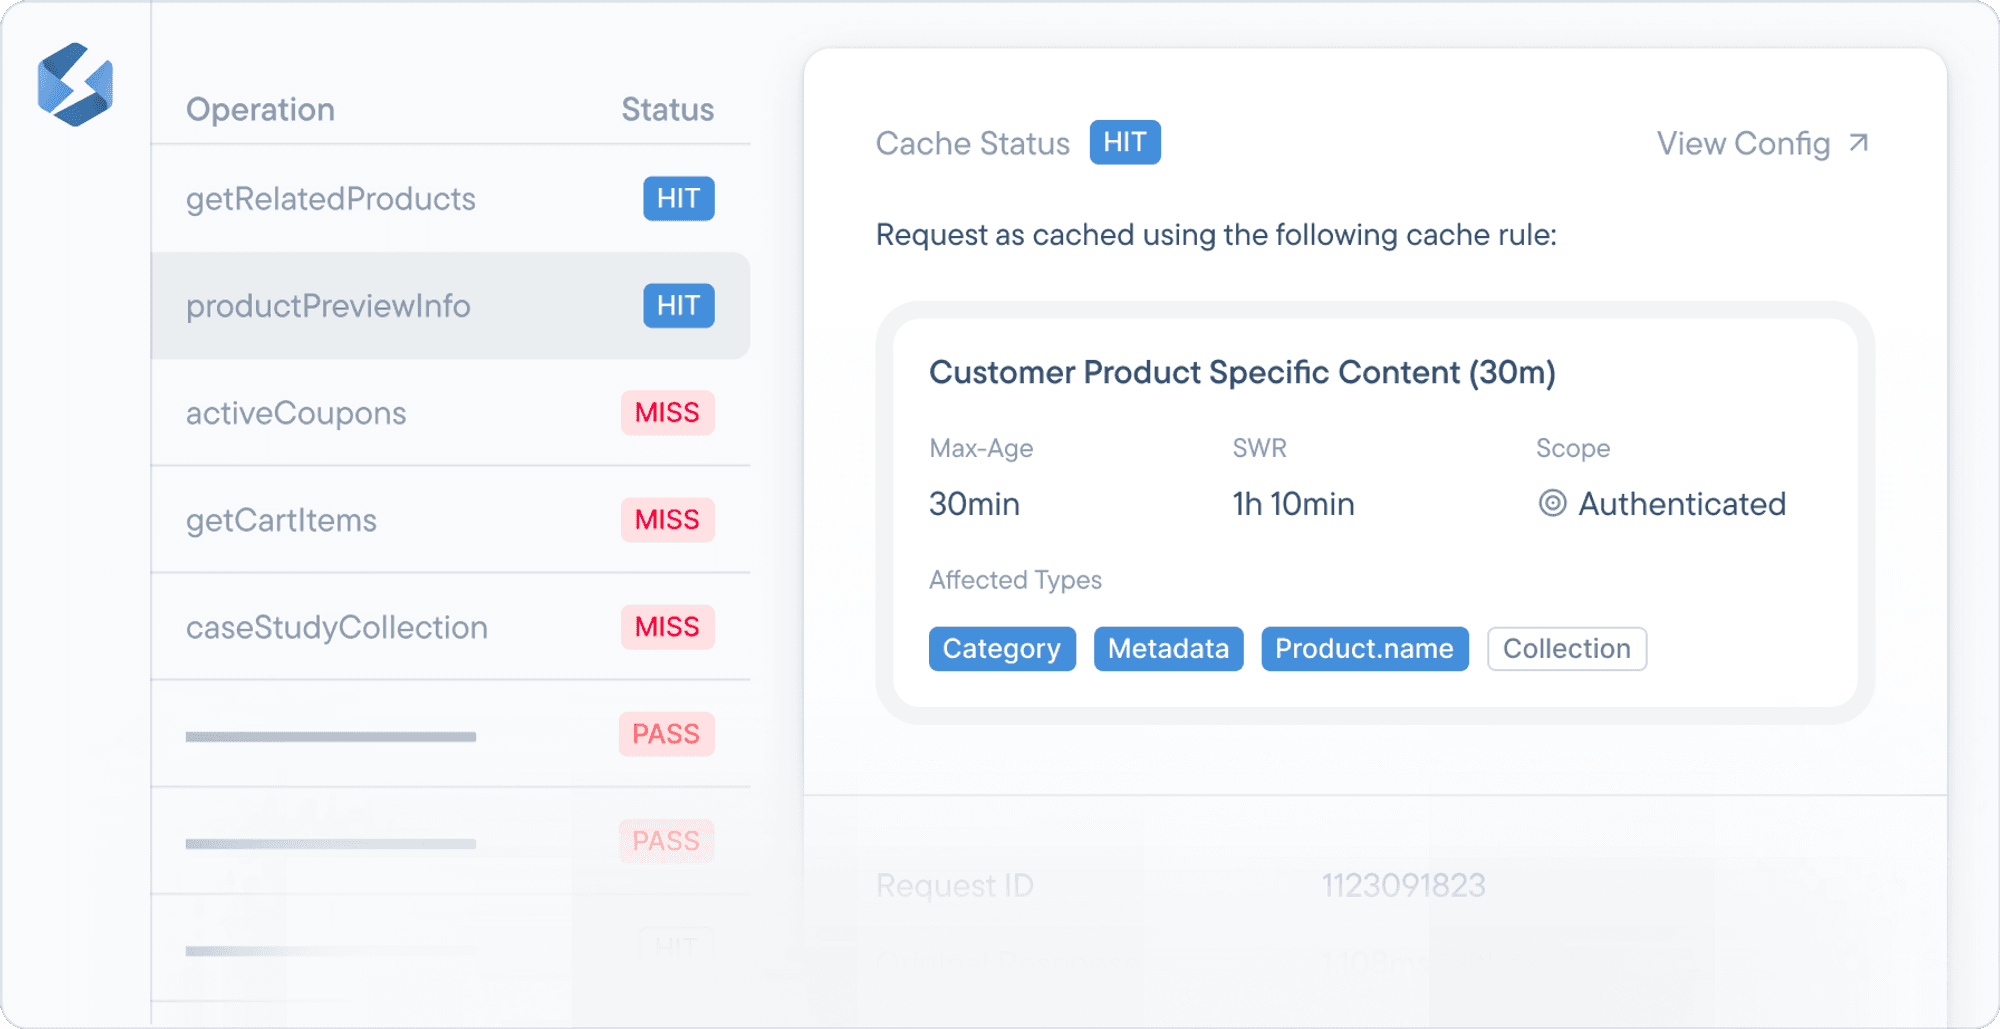
For some requests you might be getting the pass status, and now you will be able to pinpoint the reason why it is not getting cached, and get actionable information in case you want to cache that request. This can be helpful if there are multiple caching rules affecting a request, the rule with the minimum max age value will always be at the top, so you can understand why a request got a certain cache max age value.
We hope all of this makes your caching journey in Stellate even better! You can learn more about caching in our docs.