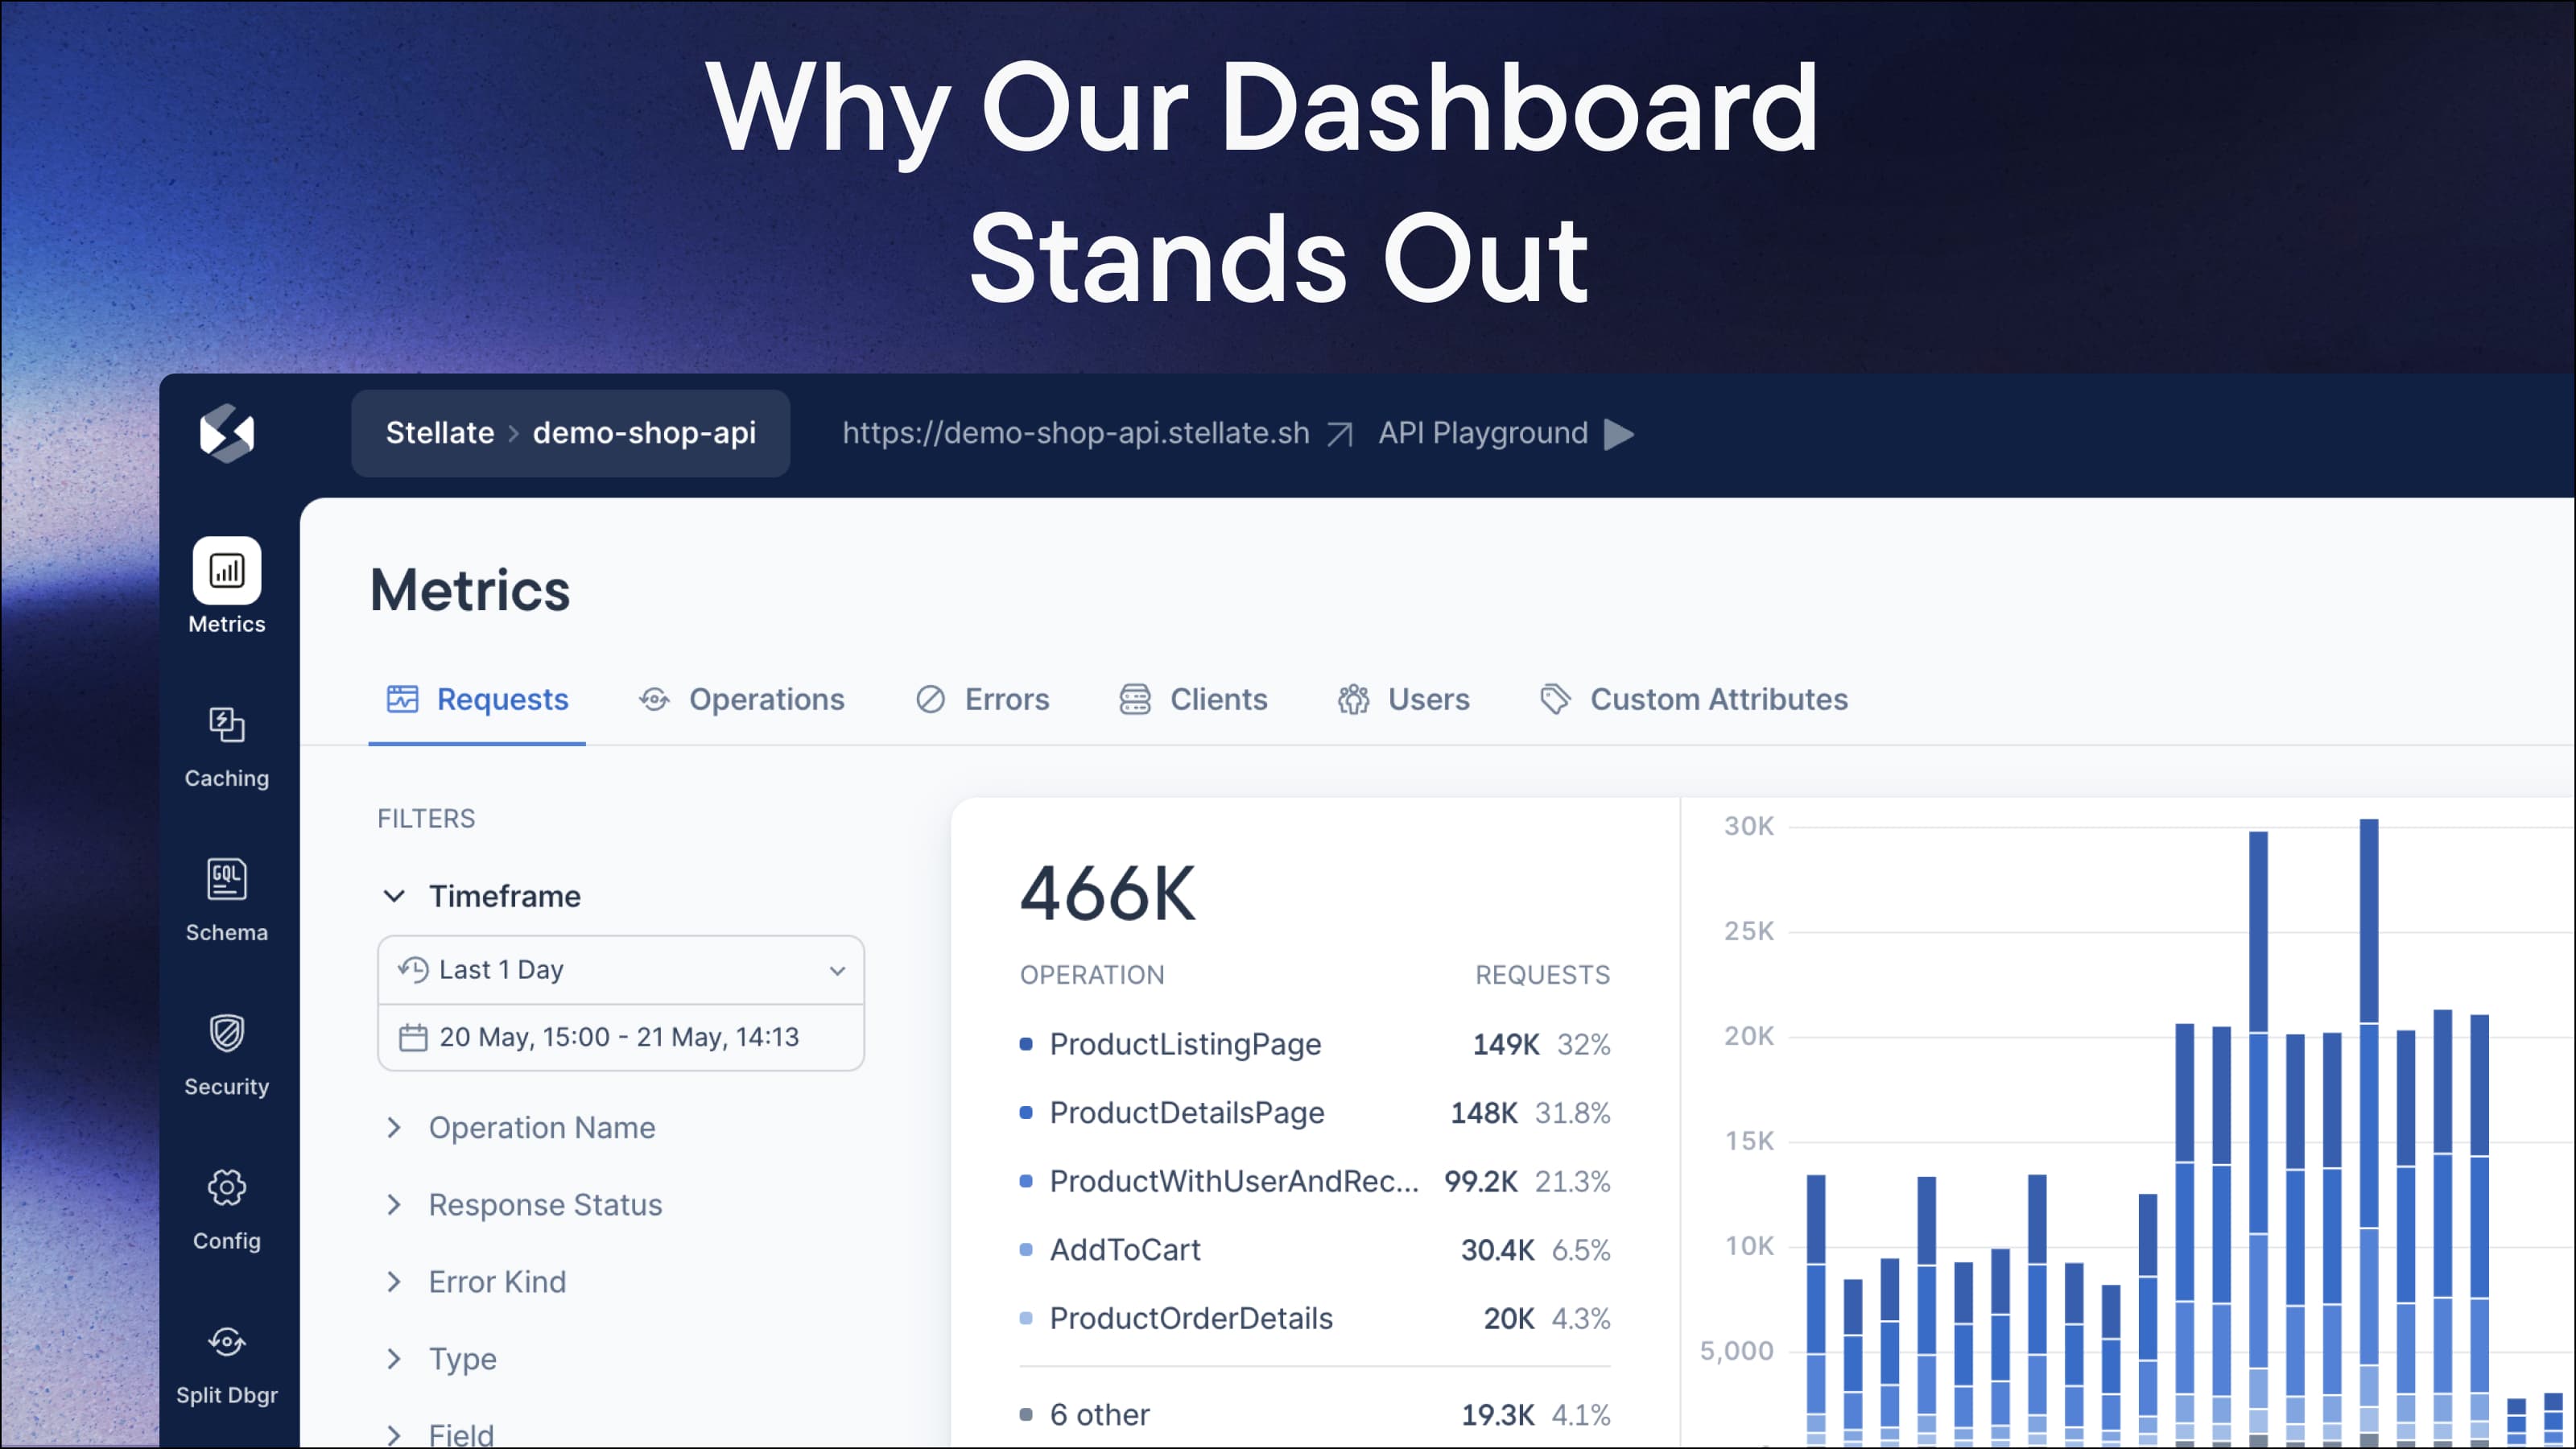
Take a peek under the hood of our React-built dashboard today! We'll reveal the styling solution we rely on, how we fetch data efficiently, and what powers those visually appealing charts. Buckle up for a technical deep dive!
Styling
From Stitches to Vanilla Extract
Our journey began with Stitches, its built-in theming and flexible component variations were enticing. However, as our component library grew and a cohesive design system became necessary, limitations emerged:
Non-typesafe tokens: We longed for TypeScript's guidance to ensure correct token usage.
Performance: Rendering hundreds of CSS-in-JS components had as runtime cost, our tables have infinite pagination so rendering many rows will sometimes cause the app to be not be smooth.
Maintenance concerns: Stitches' development stopped
After some back and forth evaluating multiple options like Tailwind and Panda, we settled on Vanilla Extract because of its zero-runtime overhead and TypeScript safety. The zero-runtime characteristic means that all the CSS is generated at build time, eliminating the need for any CSS-in-JS runtime code in the browser, which enhances performance and reduces bundle size.
Vanilla Extract's type-safety is particularly effective when using design tokens, which are essentially typed variables for style properties like colors, fonts, and spacing. By integrating with TypeScript, Vanilla Extract allows these tokens to be strictly typed, ensuring that they are used consistently and correctly throughout the application.
We initially implemented some basic layout components using Stitches, but without a comprehensive design system in place, we often found ourselves reimplementing the same component patterns repeatedly. To address this inefficiency, we decided that alongside this migration, it was essential to invest in developing a cohesive design system. This would not only streamline our workflow but also ensure consistency and reusability across our entire application.
Design system
Besides the classic form components, we love using the layout component like the Vertical Stack, Horizontal Stack and having a generic Box component means we don’t have to come up with names like WrapperContainerSection.
Our Box component uses Dessert Box created by our colleague Victor, which makes it a breeze to implement these generic layout components. Combined with Sprinkles, we have our own type-safe version of Tailwind.
<VStack gap='24px'><Box paddingX='24px' paddingTop='24px'><Heading level={3} size='16px' weight='bold'>Full Query</Heading></Box><Editorvalue={metrics.query}language='graphql'/></VStack>
Throughout the development of our design system, close collaboration with Kamil, our lead designer, has been pivotal. Kamil’s expertise in UI/UX design ensures that each component not only aligns with our aesthetic values but also adheres to the best practices in usability.
To see our components in action and explore the possibilities they offer, visit Stellate Design which is powered by Storybook.
Fetching data
As we are developing a GraphQL Platform it should come as no surprise that we use GraphQL for our api. To interact with our GraphQL API we use the urql client, which is built and maintained by our colleague Jovi.
Urql is highly customizable and versatile. We’ve configured it to use normalized caching which guarantees that our UI stays up to date, the query and mutation results may update one another if they share data, and the app will rerender or refetch data accordingly.
Setting up the urql client is simple, as you can use exchanges to tailor it precisely to your needs.
const client = createClient({suspense: true,url: graphqlDomain,exchanges: [requestPolicyExchange({ttl: 5 * 60 * 1000 /*5min*/,shouldUpgrade(operation) {return (operation.kind === 'query' &&!operation.query.definitions.every((x) => {x.kind !== Kind.OPERATION_DEFINITION || x.name?.value !== 'GetUser'}))},}),cache,retryExchange({initialDelayMs: 100,maxDelayMs: 500,randomDelay: true,maxNumberAttempts: 2,retryIf(err) {return !!err.networkError || err.response?.status === 500},}),auth,fetchExchange,]})
We also rely on custom cache resolvers to add Relay pagination which makes setting up the infinite scrolling on our tables a breeze.
One of the features used to make our dashboard feel snappier is the use of optimistic mutation updates for simpler actions. In the example below completing our onboarding flow is instant and the user doesn’t have to wait for the mutation to complete to have access to the main content of the dashboard.
optimistic: {completeServiceGuide(args, cache) {const service = cache.resolve('Query', 'service', {name: args.serviceName,})const id = cache.resolve(service as string, 'id')if (typeof id !== 'string') return nullreturn {__typename: 'Service',id,hasCompletedGuide: true,}},}
Continuing the narrative of typesafety we have integrated gql.tada into our development stack, it excels in providing type safety for GraphQL documents directly within TypeScript. This means that as we define our GraphQL queries, the types are automatically inferred, reducing the likelihood of errors and boosting our development speed.
We make heavy use of Fragments across our app, which allows us to collocate data close to the component that uses it, making it easy to reason about what data a component needs.
const FeatureFlagsFragment = graphql(`fragment UserFields_FeatureFlagsProvider on User {idfeatureFlags}`)export const FeatureFlagsProvider = ({children,user: userFrag,}: {children: ReactNodeuser?: FragmentOf<typeof FeatureFlagsFragment>}) => {const user = readFragment(FeatureFlagsFragment, userFrag)...}
Charting
Looking at nice charts makes your day better let’s be honest, so we decided to go all in on them.
We craved ultimate control over our charts, so we dove into d3 primitives like d3-shape and d3-scale. Framer-motion adds a touch of magic with animated tooltips.
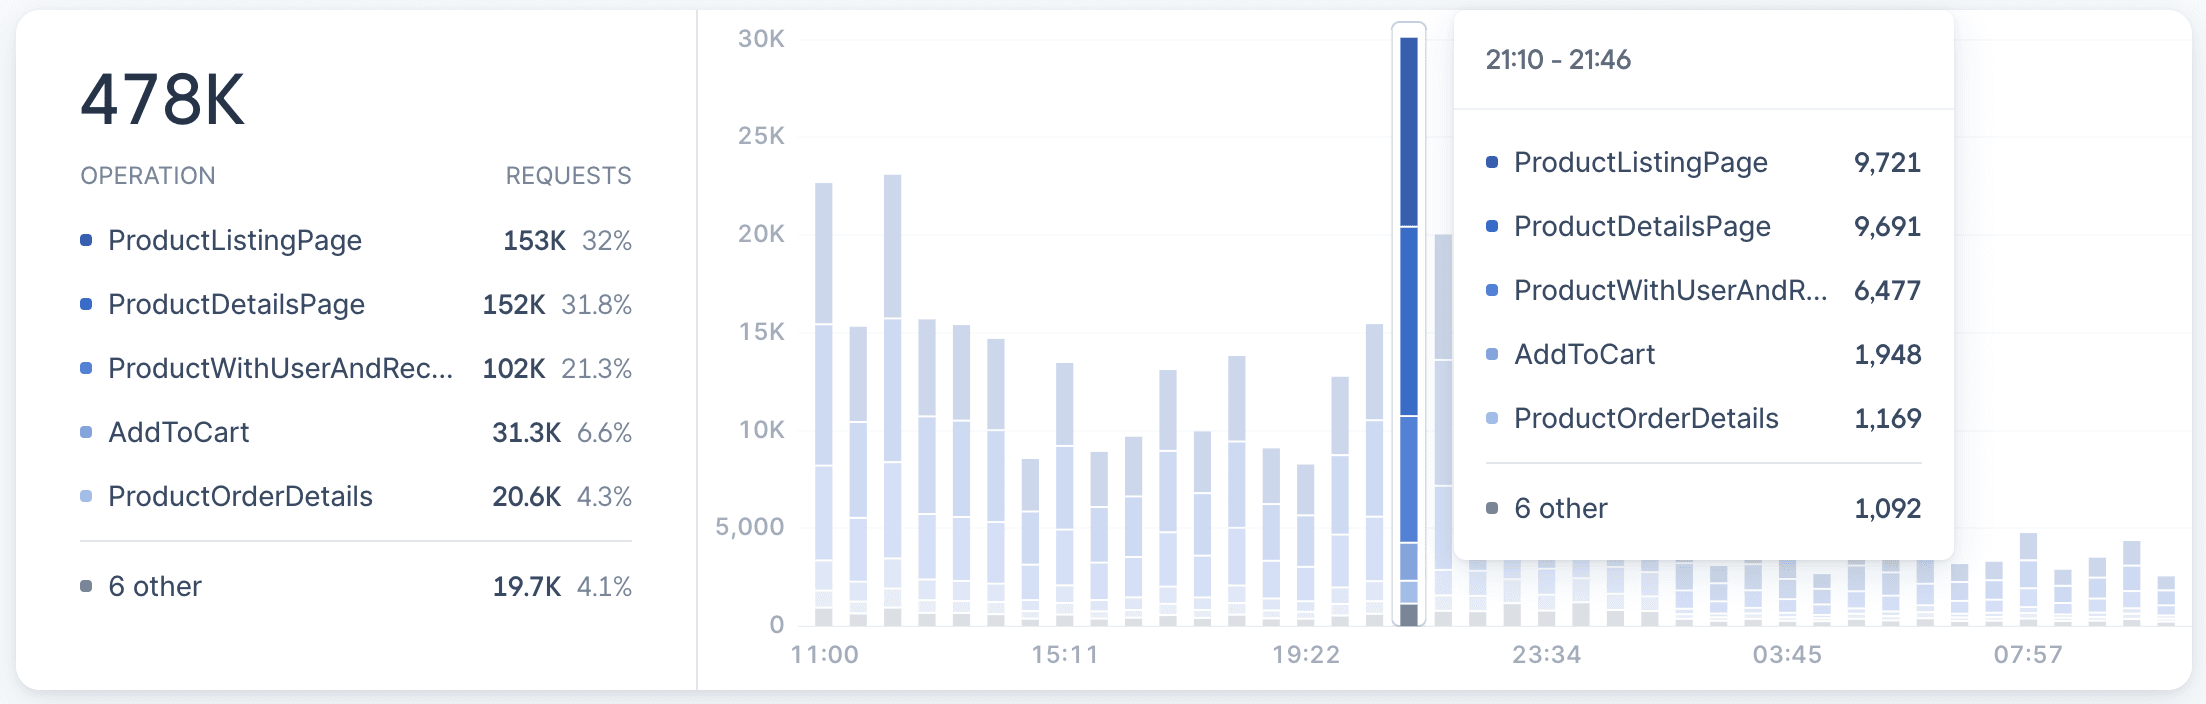
The custom code for our custom charting solutions is pretty hard to abstract and reuse, so lately we’ve been exploring using visx which seems like a good middle ground between a out of the box solution and something custom.
Visx provides a suite of reusable low-level visualization components, allowing us to maintain flexibility and control while speeding up the development process and ensuring consistency across our charts.
We hope this post has given you a deeper understanding of the intricacies and careful considerations that went into building our dashboard. From choosing the right styling solutions with Vanilla Extract to optimizing data fetching with GraphQL and urql, every decision was made to enhance performance, maintainability, and user experience.